

Postgres Missing Statistics - A quick fix for a big problem


What are Postgres Statistics?
The statistics collect information about count accesses to tables and indexes in both disk block and individual row terms. It also tracks the total number of rows in each table, and information about vacuum, and analyzes actions for each table (when they were last run on the table).
for more information: understanding-statistics-in-postgresql
Why should I care?
The Postgres Query Engine uses Postgres' statistics to generate the optimal execution plan. When the statistics don't exist or are out of date, the optimizer might generate suboptimal plans, which means unnecessarily slow queries and unnecessary IO and memory usage.
How do I know whether the statistics exist?
A query to get the main table-level statistics
SELECT relid,
        schemaname,
    relname as table_name,
    (schemaname || '.' || relname) as full_table_name,
    n_live_tup as rows,
    n_mod_since_analyze,
    n_mod_since_analyze / n_live_tup as pct_mod_since_analyze,
    last_analyze,
    last_autoanalyze,
    pg_total_relation_size(relid) / 1024 as size_kb,
    pg_size_pretty(pg_total_relation_size(relid))
FROM pg_stat_user_tables;
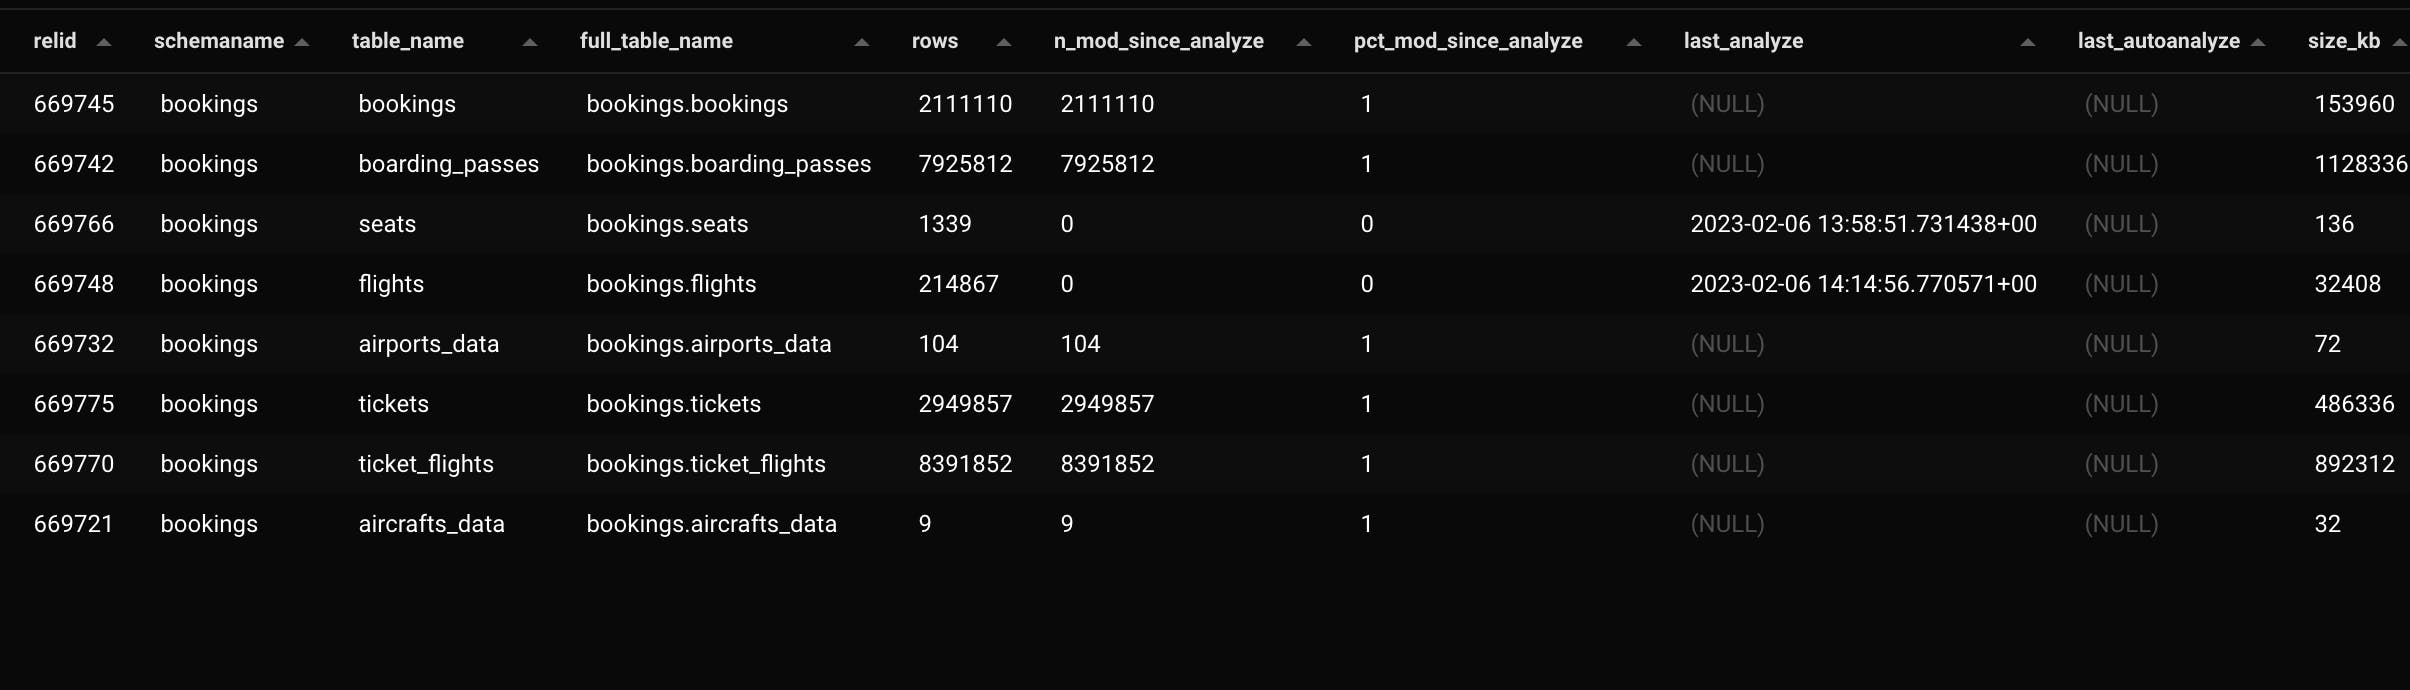
As you can see, the table booking.tickets has 2,949,857 rows and never had an ANALAYZE (the columns last_analyze, last_autoanalyze are NULL).
What is Data Distribution Statistics?
These statistics are related to the data distribution for each relation. They provide information about the most common values in each column in a relation, average width of the column, number of distinct values in the column, and more. They’re collected when we run ANALYZE or when analyze is triggered by autovacuum, and are stored in the pg_statistic system catalog (whose public readable view is pg_stats).
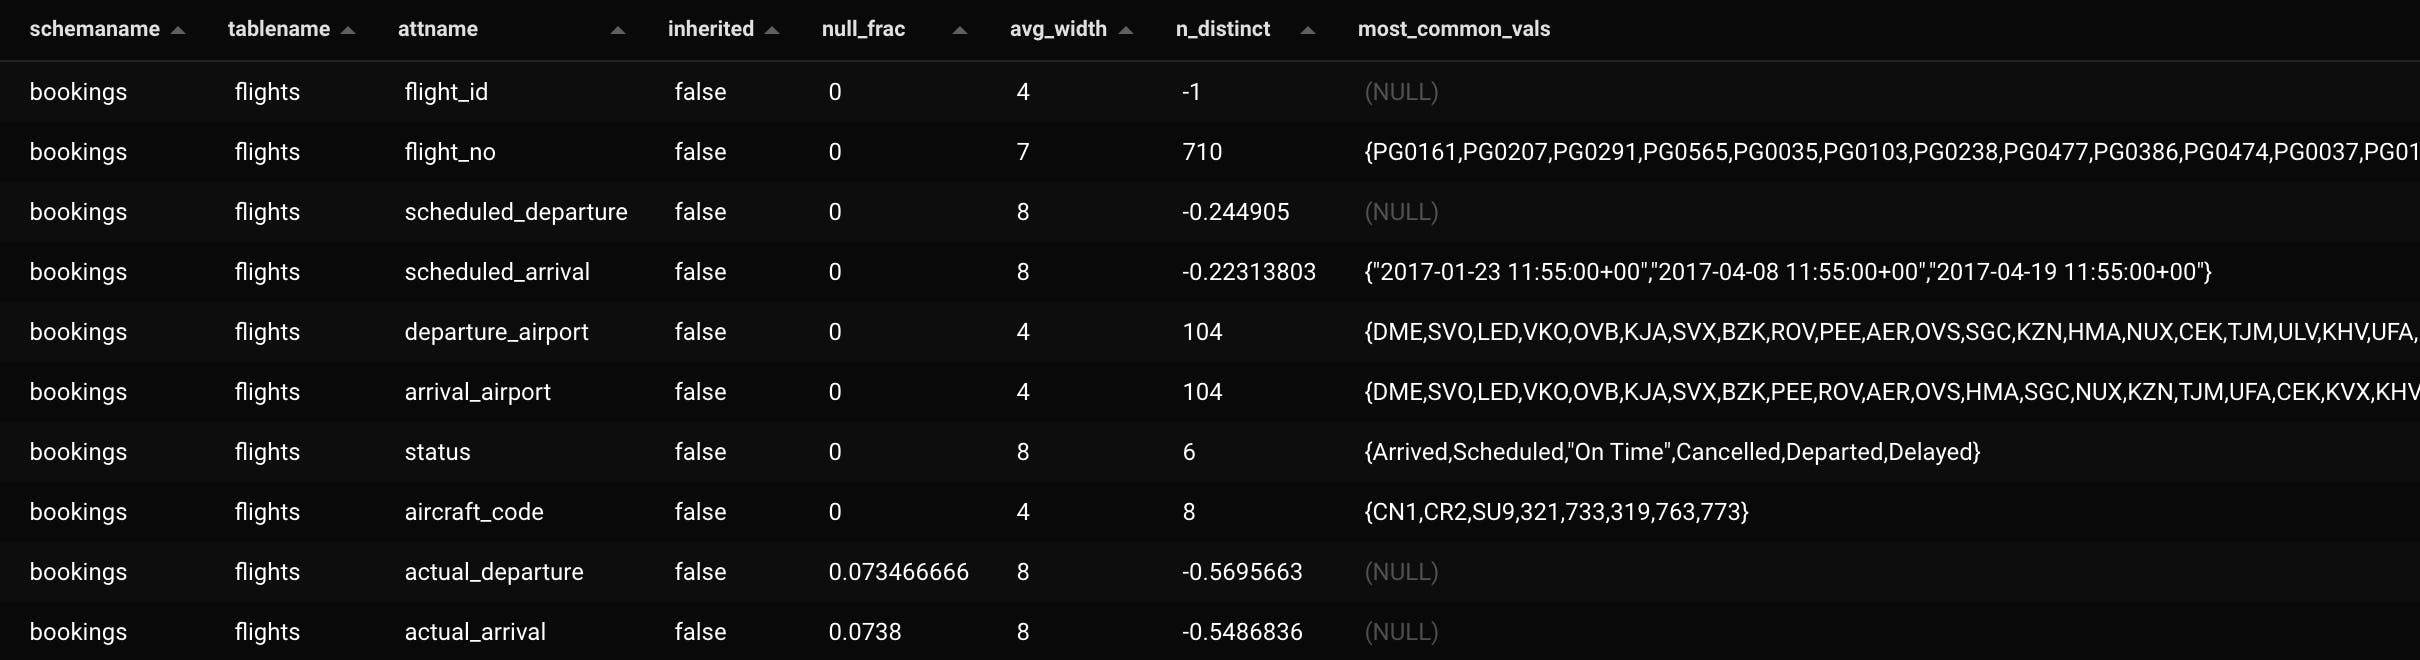
Following the example above, there are no rows in pg_stats for the table booking.tickets. But the table booking.flights has a row for every column in the table
-- No data
SELECT *, (schemaname || '.' || tablename)
FROM pg_stats as s
WHERE schemaname NOT IN ('pg_catalog', 'information_schema' )
 AND (schemaname || '.' || tablename) = 'bookings.tickets'
-- The table bookings.flights was analyzed.
SELECT *, (schemaname || '.' || tablename)
FROM pg_stats as s
WHERE schemaname NOT IN ('pg_catalog', 'information_schema' )
 AND (schemaname || '.' || tablename) = 'bookings.flights'
How do Missing Data Distribution Statistics Affect the Query Plan?
Let's take the following SQL command. It returns 201 rows. Obviously, the PG Query Engine doesn't know that BEFORE running the query. It estimates there are 14,749 rows.
select *
from bookings.tickets
where passenger_name = 'ARTEM VOROBEV'
plan:
[{"Plan":{"Node Type":"Gather","Parallel Aware":false,"Startup Cost":1000,"Total Cost":67253.74,"Plan Rows":14749,"Plan Width":206,"Output":["ticket_no","book_ref","passenger_id","passenger_name","contact_data"],"Workers Planned":2,"Single Copy":false,"Plans":[{"Node Type":"Seq Scan","Parent Relationship":"Outer","Parallel Aware":true,"Relation Name":"tickets","Schema":"bookings","Alias":"tickets","Startup Cost":0,"Total Cost":64778.84,"Plan Rows":6145,"Plan Width":206,"Output":["ticket_no","book_ref","passenger_id","passenger_name","contact_data"],"Filter":"(tickets.passenger_name = 'ARTEM VOROBEV'::text)"}]}}]
Now let's add an index. As you can see, adding an index alone is not a magic solution, as the PG engine still "thinks" 14,749 rows will return and makes the Execution Plan based on this number.
CREATE INDEX idx_tickets_passenger_name on bookings.tickets (passenger_name)
Plan:
[{"Plan":{"Node Type":"Bitmap Heap Scan","Parallel Aware":false,"Relation Name":"tickets","Schema":"bookings","Alias":"tickets","Startup Cost":170.73,"Total Cost":32069.48,"Plan Rows":14749,"Plan Width":206,"Output":["ticket_no","book_ref","passenger_id","passenger_name","contact_data"],"Recheck Cond":"(tickets.passenger_name = 'ARTEM VOROBEV'::text)","Plans":[{"Node Type":"Bitmap Index Scan","Parent Relationship":"Outer","Parallel Aware":false,"Index Name":"idx_tickets_passenger_name","Startup Cost":0,"Total Cost":167.05,"Plan Rows":14749,"Plan Width":0,"Index Cond":"(tickets.passenger_name = 'ARTEM VOROBEV'::text)"}]}}]
Now let's ANALYZE the table and run the query again. Now the planner has a close enough estimation: 262 rows. In this particular case, there isn't a big impact on the execution plan but it other cases, making a good estimation can generate a totally different plan.
ANALYZE tickets
https://www.postgresql.org/docs/current/sql-analyze.html:
Plan (pretty close numbers):
[{"Plan":{"Node Type":"Bitmap Heap Scan","Parallel Aware":false,"Relation Name":"tickets","Schema":"bookings","Alias":"tickets","Startup Cost":6.46,"Total Cost":1000.5,"Plan Rows":262,"Plan Width":104,"Output":["ticket_no","book_ref","passenger_id","passenger_name","contact_data"],"Recheck Cond":"(tickets.passenger_name = 'ARTEM VOROBEV'::text)","Plans":[{"Node Type":"Bitmap Index Scan","Parent Relationship":"Outer","Parallel Aware":false,"Index Name":"idx_tickets_passenger_name","Startup Cost":0,"Total Cost":6.39,"Plan Rows":262,"Plan Width":0,"Index Cond":"(tickets.passenger_name = 'ARTEM VOROBEV'::text)"}]}}]
Does Postgres un ANALYZE automatically?
In the default PostgreSQL configuration, the autovacuum daemon takes care of automatic analyzing of tables when they are first loaded with data, and as they change throughout regular operation. When autovacuum is disabled, it is a good idea to run ANALYZE periodically, or just after making major changes in the contents of a table. Accurate statistics will help the planner to choose the most appropriate query plan, and thereby improve the speed of query processing. A common strategy for read-mostly databases is to run VACUUM and ANALYZE once a day during a low-usage time of day. (This will not be sufficient if there is heavy update activity.)
PostgreSQL database tables are auto-vacuumed by default when 20% of the rows plus 50 rows are inserted, updated, or deleted. (source: https://www.netiq.com/documentation/cloud-manager-2-5/ncm-install/data/vacuum.html )Tables are auto-analyzed when a threshold is met for 10% of the rows plus 50 rows. For example, a table with 10000 rows is not auto-vacuumed until 2050 rows are inserted, updated, or deleted. That same table is auto-analyzed when 1050 rows are inserted, updated, or deleted.
The default auto-vacuum analyze and vacuum settings are sufficient for a small deployment, but the percentage thresholds take longer to trigger as the tables grow larger. Performance degrades significantly before the auto-vacuum vacuuming and analyzing occurs.
To check the actual configuration run the following query. Check first for the values of autovacuum and track_counts
select *
from pg_settings
where name like '%vacuum%'
or name = 'track_counts'
order by 1
Action Items
Check whether there are statistics for each table. You can find the query above.
Even if there are Data Distribution Statistics, still check how many days ago those statistics were created.
Check how many changes were made since the last change (column n_mod_since_analyze). If a table is static or had a few changes, then probably it is OK not to update the statistics and probably this is not the root cause for slow queries on this table.
Run ANALYZE on the tables with out-of-date statistics.