Advanced SQLAlchemy Logging using OpenTelemetry
View and Analyze the REST API with its related SQL commands using a few lines of code
In this post you’ll learn about:
- The limitations of the built-in SQLAlchemy Logs
- Creating traces to log the REST calls and their SQL commands using OpenTelemetry
- Tools to Visualize the traces
- How to apply advanced SQL analysis to detect common problems and prevent them from hitting the production DB
Why Should I care?
- When you build your SQLAlchemy app, using Flask or FastAPI, it is important to link the REST command to the SQL commands it generates. ORMs are notorious for generating inefficient SQL commands. Therefore you should look on the SQL and review it.
- The built-in log of SQLAlchemy is not great, it is hard to see the REST and the SQL commands OpenTelemetry is an observability framework that can be easily instrumented to show the REST and its SQL Commands. Many tools support the OpenTelemetry traces. Other tools, such as Metis, can integrate with the Open Telemetry traces to quickly analyze the SQL commands, on scale, and prevent DB-related problems from hitting production.
Using SQLAlchemy built-in log to collect the SQL and REST API
In Python, the built-in logging module is the standard way of doing application logs, and most third-party libraries integrate well with it.
You can see an example of the built-in logging with Flask here: The results are similar to this:
[2022-08-09 18:17:30,355] INFO werkzeug: 127.0.0.1 - - [09/Aug/2022 18:17:30] "GET /api/user/list HTTP/1.1" 200 -
Then you should run the command SQLALCHEMY_ECHO = True to log the SQL commands. The results look similar to this:
[2022-08-10 10:41:57,089] INFO sqlalchemy.engine.Engine: BEGIN (implicit)
[2022-08-10 10:41:57,090] INFO sqlalchemy.engine.Engine: SELECT user.id AS user_id, user.username AS user_username FROM user
[2022-08-10 10:41:57,090] INFO sqlalchemy.engine.Engine: [generated in 0.00015s] {}
What’s wrong with the out-of-the-box logging of SQLAlchemy ?
As you can see, the main problems are:
- There is no format for the logs, every developer can configure any format they want, which make it harder to analyze the logs.
- It is very hard to link the REST command with the SQL it generates. Especially if you work in an a-sync mode.
- You need to forward (export) the data to an Application Performance Monitoring (APM) or a Log Analysis solution, such as AWS CloudWatch/ELK/DataDog/New Relic etc.
- The logger writes every SQL as is, with its actual values. For ex. SELECT FROM tbl_students WHERE student_id = 1; This is great for QA. However, such monitoring won’t wrok in the Produciton environment, as queries should be grouped by their pattern. Instead of 1000 different queries, each with different parameters, effective monitoring requires generating a pattern, such as SELECT FROM tbl_students WHERE student_id = ?. This is another step you’ll need to take care of.
- You need to manually configure and collect the execution plans to analyze the quality of the queries, such as missing indexes, SQL injections or N+1.
What is OpenTelemetry and how can it help?
OpenTelemetry is a collection of tools, APIs, and SDKs. Use it to instrument, generate, collect, and export telemetry data (metrics, logs, and traces) to help you analyze your software’s performance and behavior.
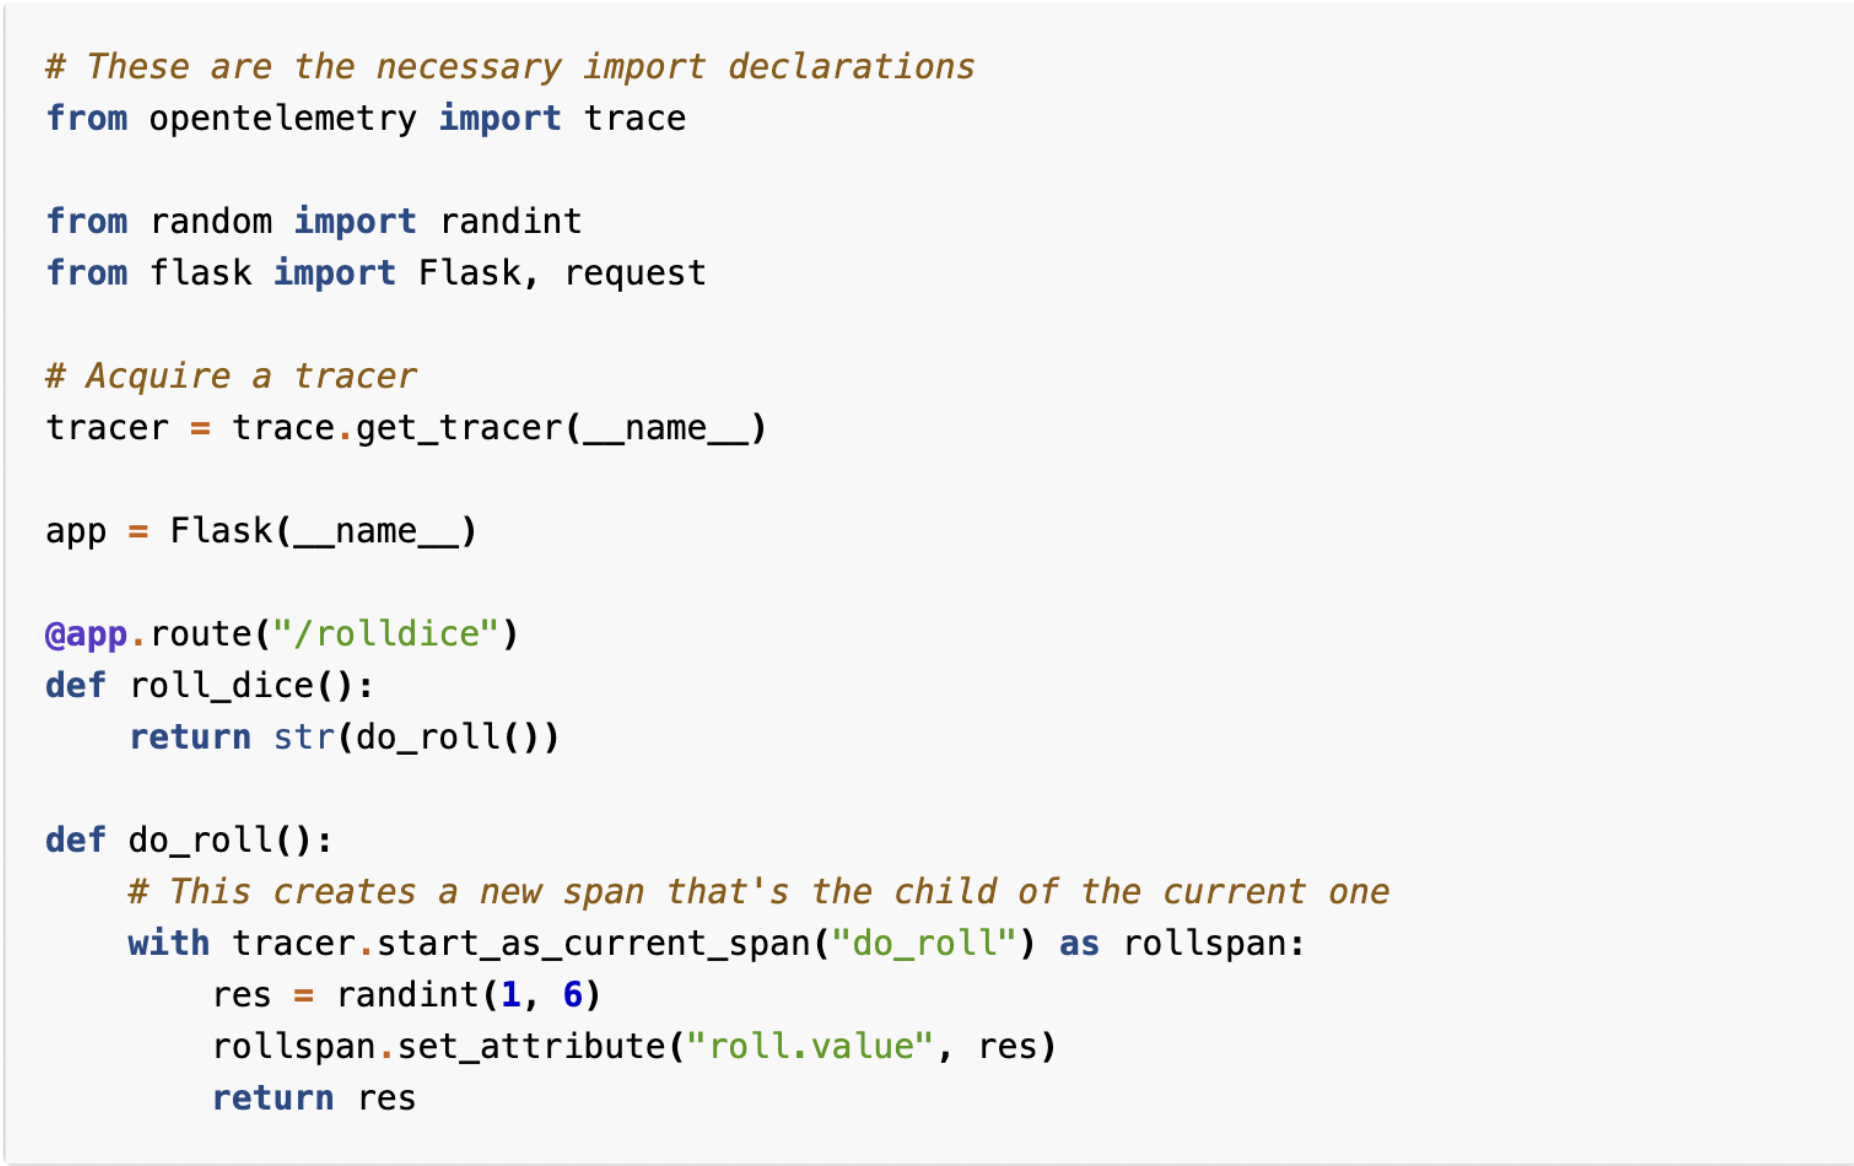
- With OpenTelemetry we can easily instrument SQLAlchemy to generate traces of the REST and SQL. It is very easy to link the REST to the relevant SQL commands as they all share the same Trace ID.
- The traces follow the open-sourced specification. The SDK can be exported, as JSON, to all popular APMs using existing, well-tested, libraries. You only need to instrument them with a few lines of code.
- The APMs have built-in functionality to group the traces and to show the details of a specific trace.
- Every SQL command contains a unique Trace ID, stored as a comment at the end of the SQL text. That allows us to also add the execution plan of the SQL command. Using Open Telemetry has a minor impact on performance and now become the best practice for distributed systems. In this context, having a database and application server make your system distributed.
The instrumentation of OpenTelemetry for SQLAlchemy
Step 1 - Instrument Flask or Fast API using OpenTelemetry SDK, following the official documentation:
Step 2 - Instrument SQLAlchemy The SDK generates OpenTelemetry output as JSON. You’ll need to manually configure how to export the data to the APM. You’ll need an API Key from the APM. Notice the SDK for SQLAlchemy doesn’t collect the execution plan. For that, you’ll have to configure Slow Query Log + Auto Explain and then manually analyze the plans.
Step 3 - Select an APM and configure an exporter.
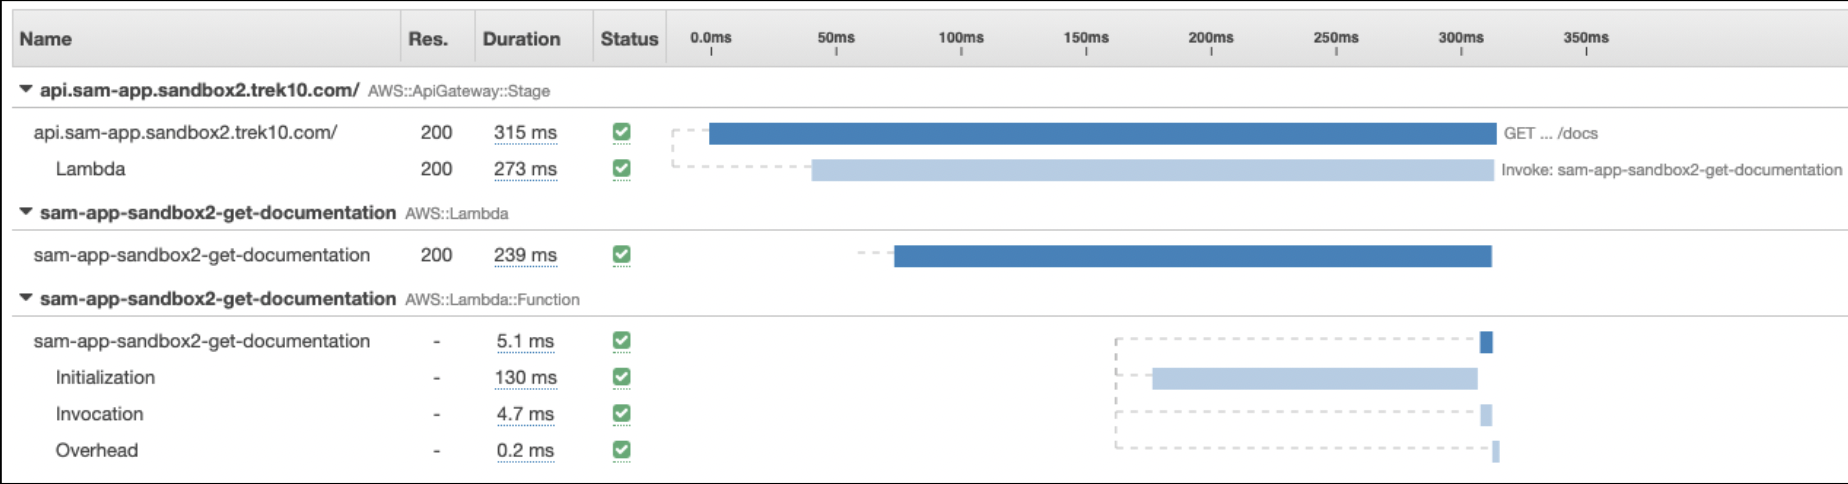
For ex. Use AWS Open Telemetry Distro to export the traces to AWS X-Ray.
Example of a Distributed Trace in AWS X-Ray
 Step 4 - Configure AWS RDS Slow Query Log + Auto Explain
Log the execution plans. AWS RDS saves the logs to CloudWatch.
Step 4 - Configure AWS RDS Slow Query Log + Auto Explain
Log the execution plans. AWS RDS saves the logs to CloudWatch.
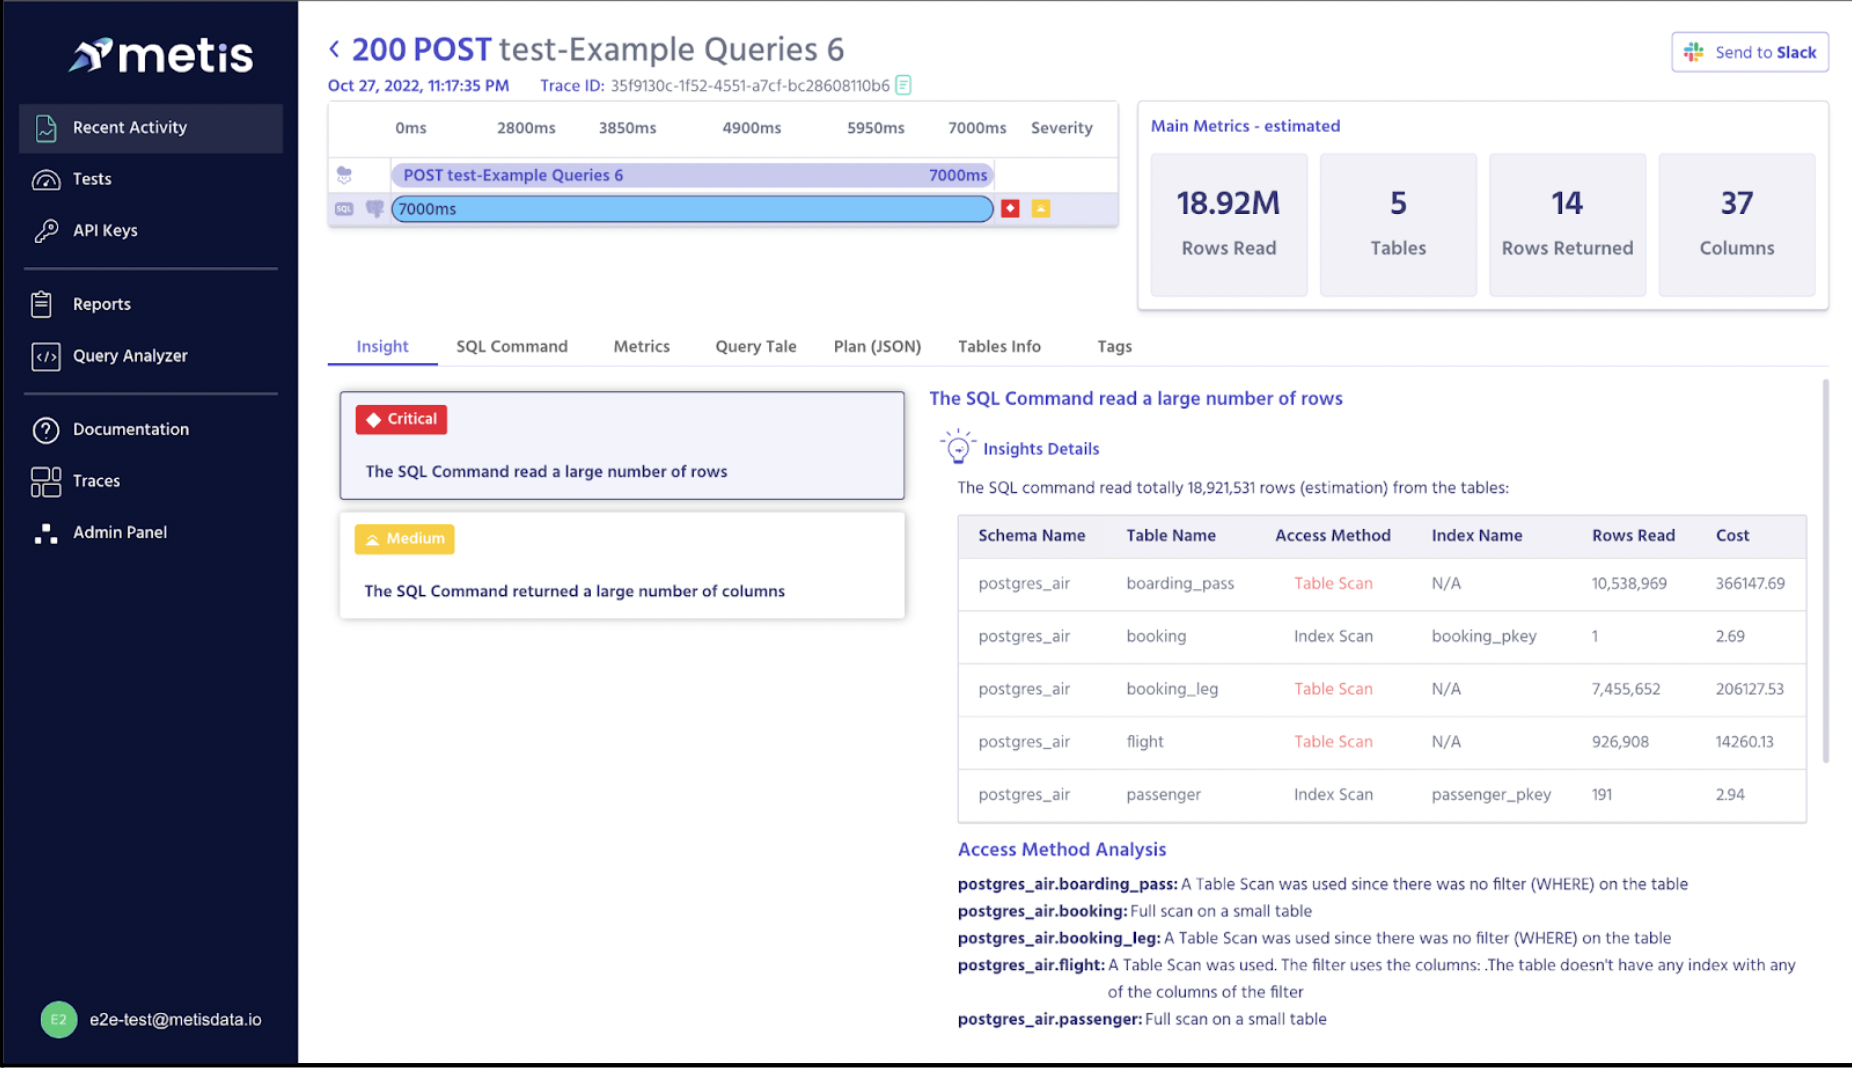
Step 5 - Analyze the execution plan to understand the efficiency of the queries.
Option 2 - Simpler instrumentation using Metis SDK
Single instrumentation of SQLAlchemy with [Flask] (https://pypi.org/project/sqlalchemycollector/) or FastAPI. Export the data to Metis just by providing the API Key. You can get an API Key at https://metisdata.io. You can start with the generous free tier.
# Flask
Installation
pip install sqlalchemycollector

Configuration
from flask import Flask
from flask_sqlalchemy import SQLAlchemy
from sqlalchemycollector import setup, MetisInstrumentor, PlanCollectType

# existing app initialization
app = Flask(...)
db = SQLAlchemy(app)


# To start collecting the logs:
instrumentation: MetisInstrumentor = setup('<SERVICE_NAME>',
                                           api_key='<API_KEY>' )
instrumentation.instrument_app(app, db.get_engine())
The SDK also collects the execution plan, no need to take any action on the DB. The Web App provides advanced SQL Analysis.
Conclusion
The future of observability is OpenTelemetry. It provides an immediate value of distributed traces, to gain insights on the REST commands and the SQL commands. Since all main APM vendors support it, and the format is universal, there is no vendor lock. The instrumentation should be done once and the only question is where should the traces be exported too. OpenTelemetry also opens new capabilities of advanced analysis, using tools such as Metis, for deep SQL insights.


