

By Itay Braun, CTO, Metis
Why Should I care?
As a developer, you want to build a great product, move fast and focus on new features. ORM frameworks, such as Sequelize, SQLAlchemy and Hibernate, let you focus on the code and hide the DB structure. Linking the REST and the SQL can be very useful for troubleshooting. The whole concept of distributed traces is creating a clear link between the different parts of the app (server, DB, Storage, external API…). Using the traces of REST / GQL and SQL simplifies troubleshooting data or performance problems.
Nowadays it is the best practice to instrument sending traces and a good observability solution to easily analyze them.
Can you give me 3 real-world examples?
- Data Quality - something is wrong with the data in the Production DB. You need to understand why and you need to do that quickly. Detailed traces are the key to reproducing the problem and solving it. Would be 10x longer to solve the problem without traces.
- The server returns DB-related errors, maybe a violation of a Primary Key, or the data is too long for the column. With traces, you can detect the root cause much faster.
- Performance - get a clear understanding of what percentage of the overall duration is spent on the DB compared to the network and the app server itself. Maybe the query, generated by the ORM joins 10 tables? Maybe it sends dozens of queries instead of one (N+1 problem)?
What is Distributed Tracing?
Distributed tracing is a method of tracking application requests as they flow from frontend devices to backend services and databases. They give us the big picture and the details of each step (also known as “span”). Developers can use distributed tracing to troubleshoot slow requests which return errors. Distributed Tracing vs. Logging: Both distributed tracing and logging help developers monitor and troubleshoot performance issues. Logs can originate from the application, infrastructure, or network layer, and each time-stamped log summarizes a specific event in your system. For example, a DB may emit a log when it runs out of storage to save new data. A distributed trace, on the other hand, occurs only at the application layer and provides visibility into a request as it flows across service boundaries. Using a trace, you can visualize the entire request path and determine exactly where a bottleneck or error occurred.
An example of a Distributed Trace: developers can easily see the caller REST or GQL command and the related SQL commands. In OpenTelemetry’s terminology, we say the parent Trace (REST or GQL) has DB spans.
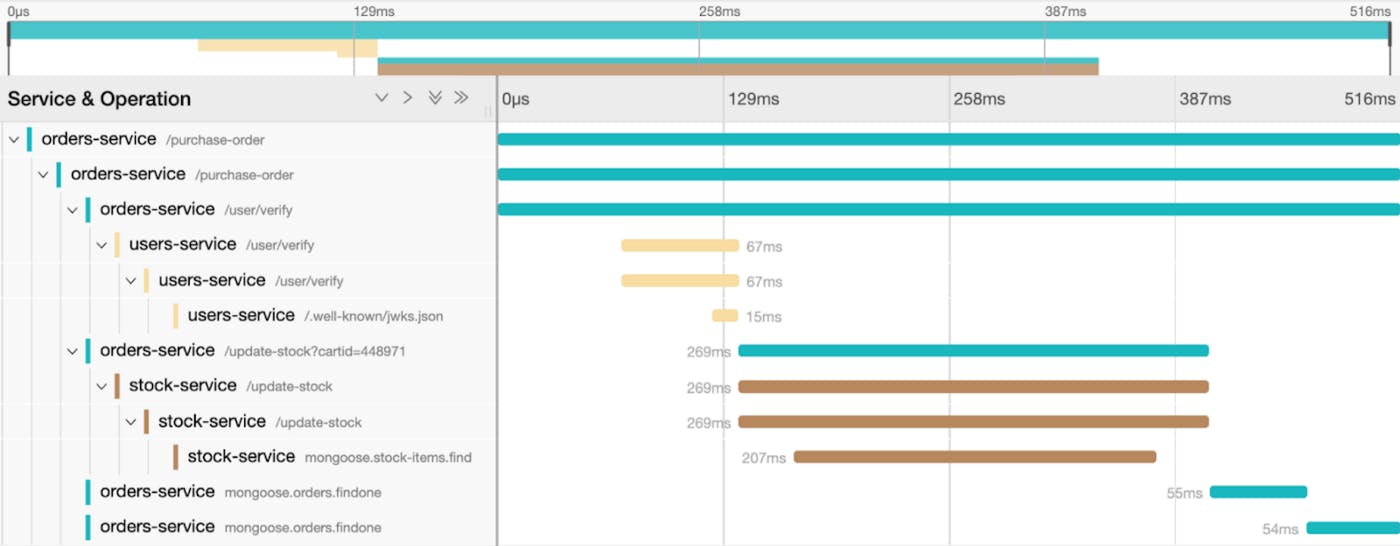 The image was taken from: Jaeger Tracing: A Friendly Guide for Beginners
What is OpenTelemetry and Why is it so important for the future of Observability?
OpenTelemetry is an open-source observability framework. It provides a universal specification of metrics, logs and traces, supported by many vendors, both on the code/frameworks side and on the APM (Application Performance Monitoring) side. That means all main vendors of APM, such as DataDog and NewRelic, support traces
With OpenTelemetry the implementation of an observability solution is much simpler. Most popular frameworks already got an OpenTelemetry SDK, instrumented in a few lines of code and with almost no impact on performances, using a few lines of code. There is no vendor lock, the data can be sent to your favorite APM.
For example OpenTelemetry Auto Instrumentation for Django
opentelemetry-instrument python manage.py runserver --noreload
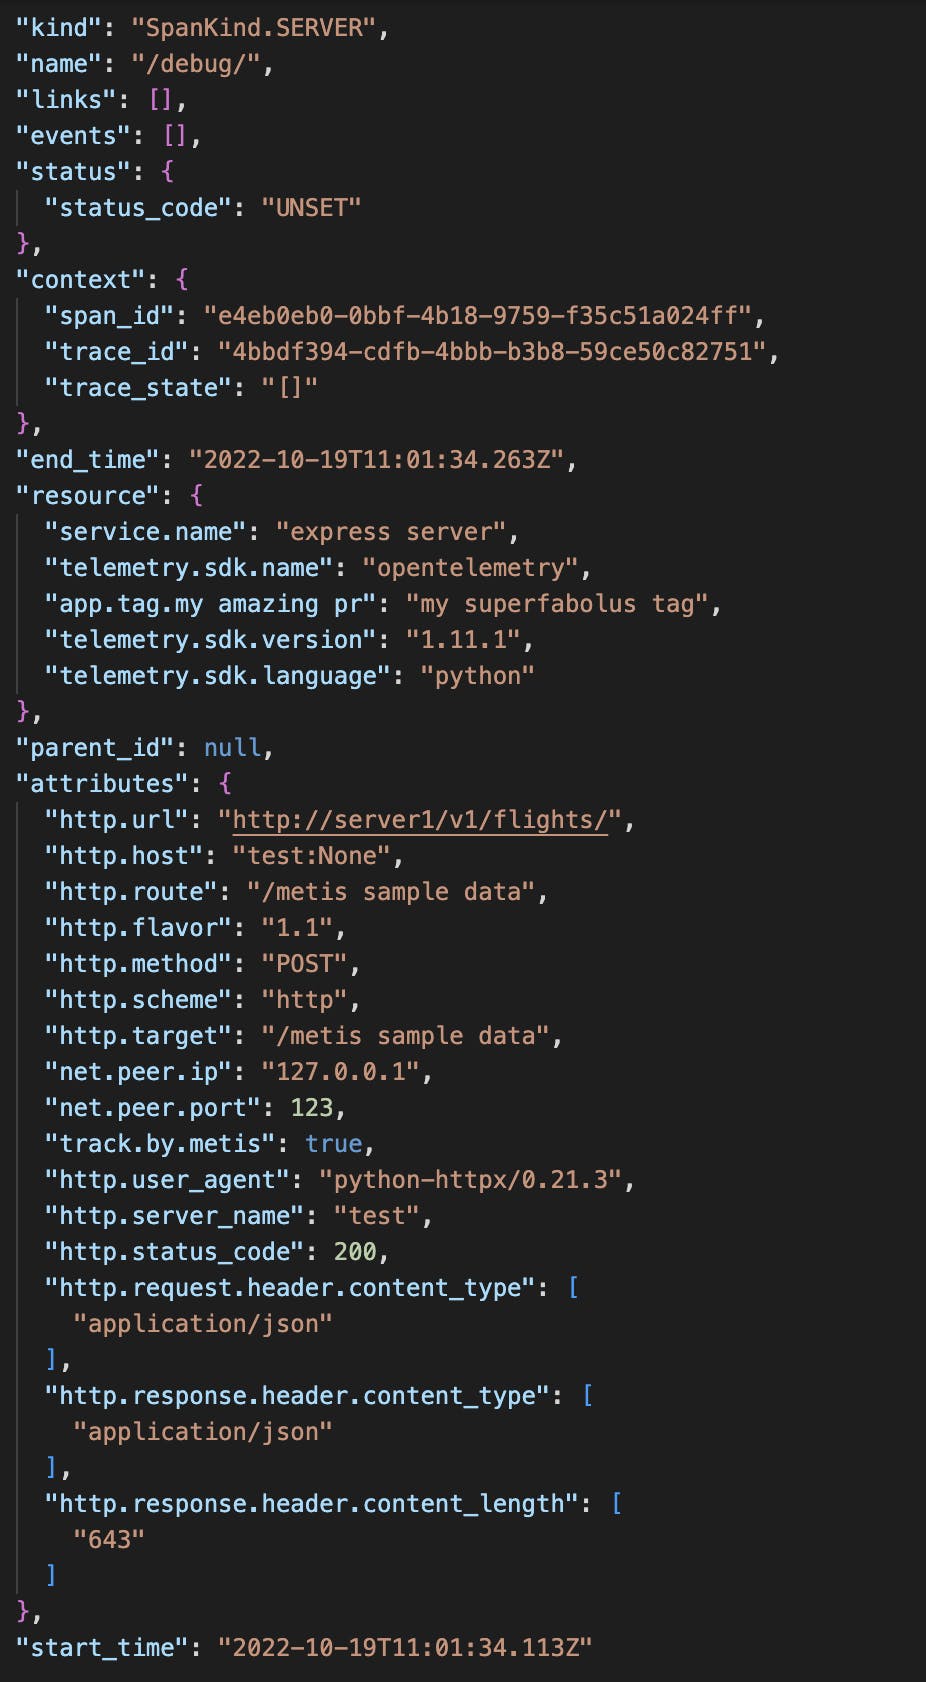
An example of an OpenTelemetry span in OpenTelemetry for a REST command. Notice the “kind” property. The REST command is “spanKind.SERVER”. Also notice the Trace ID.
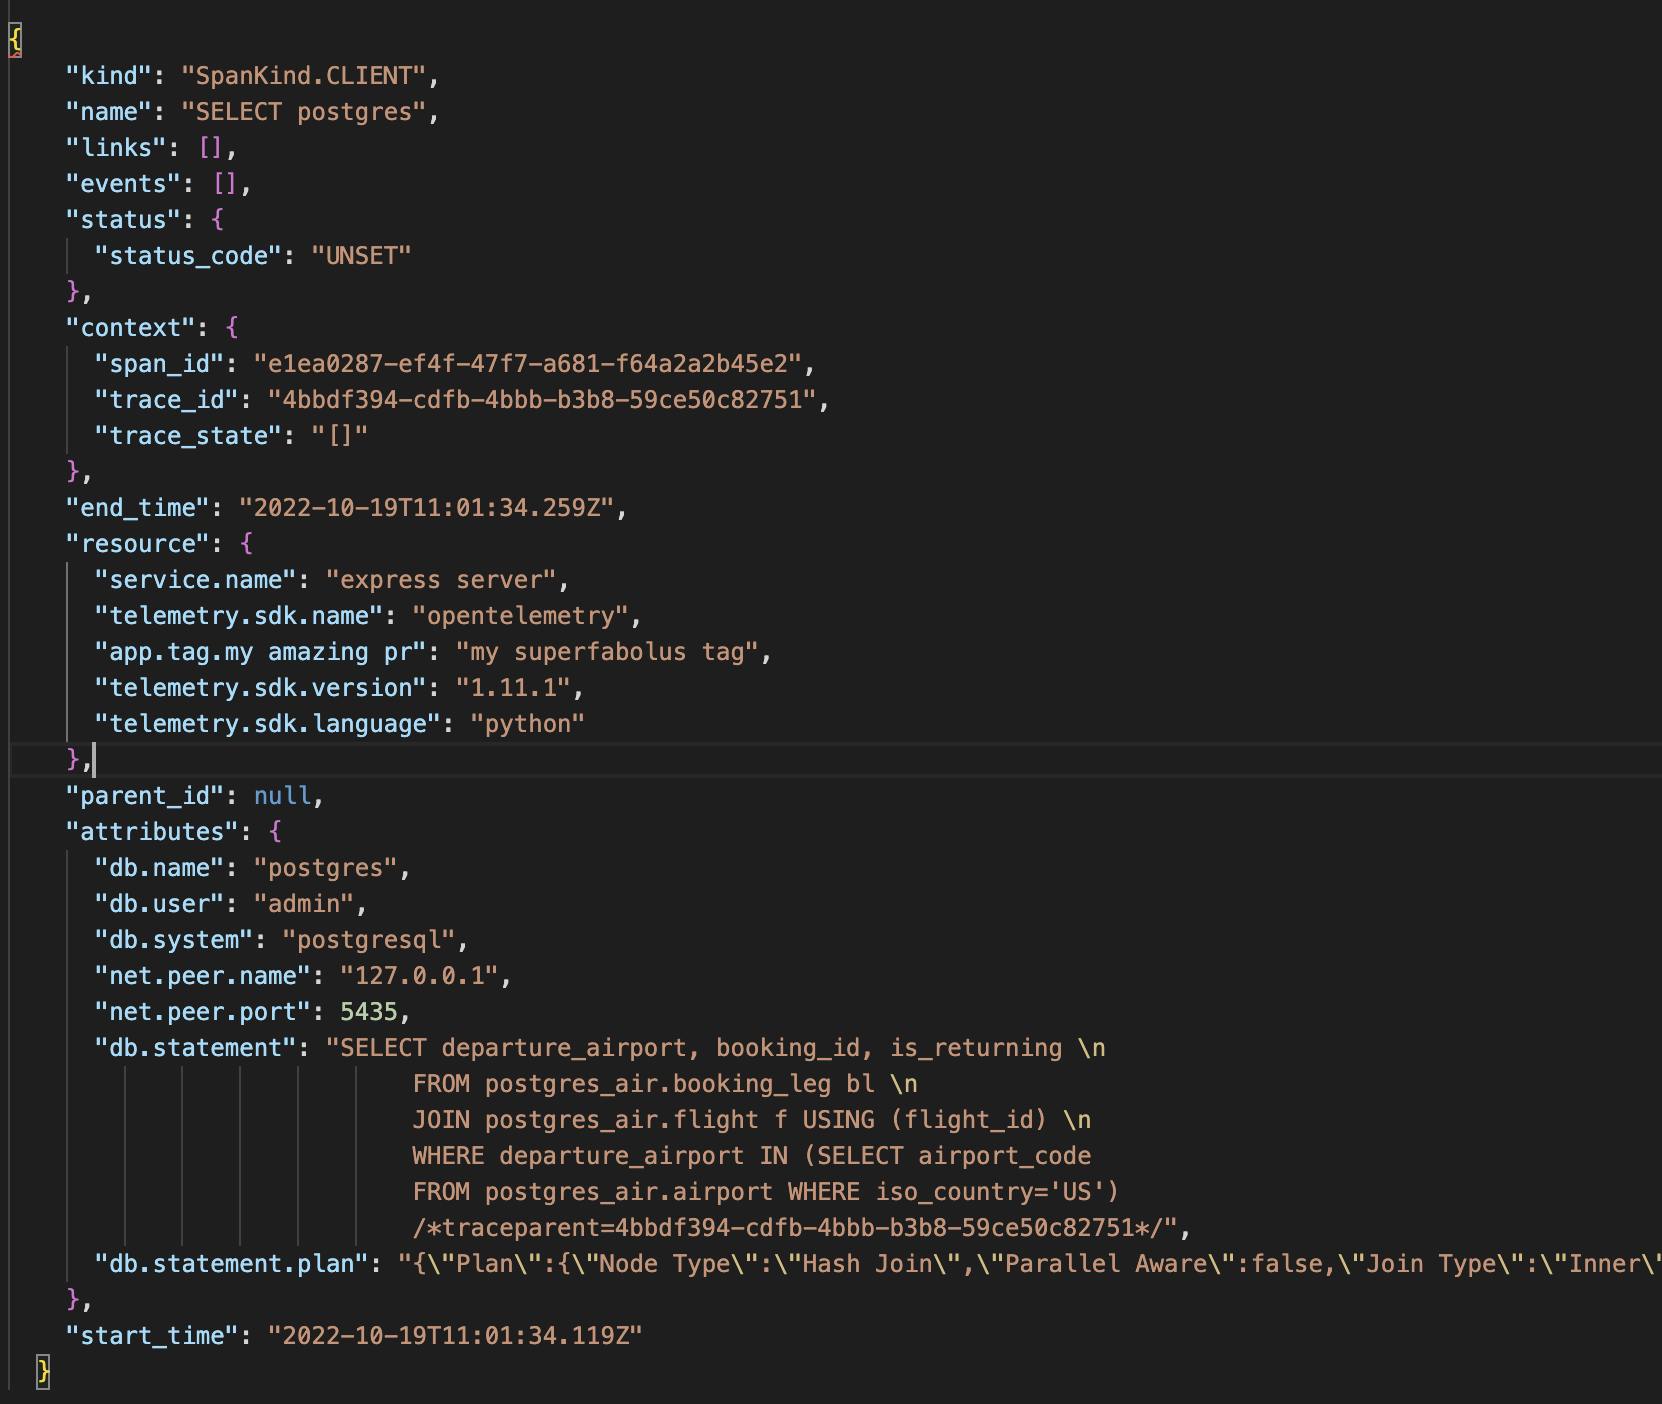
An Example of an OpenTelemetry span for an SQL command.
- The SQL span uses the same trace ID as the Rest command.
- The SQL text has a comment added by the OpenTelemetry SDK. The comment also contains the Trace ID. Google created an open-sourced project called SQL Commenter, to add the Trace ID as a comment at the end of the SQL command. Later it was donated to OpenTelemetry to “extend the vision of OpenTelemetry to databases”.
- In this example, the span also contains the estimated execution plan of the SQL command. This is not part of the native OpenTelemtry implementation but an extension created by Metis. Hopefully, at some point, it would be supported by all SDKs.
Distributed Traces in the Production Environment vs the Staging One
There are a few differences between using traces in the Production Environment and the Staging One
- Grouping vs high cardinality: The Production Environment can generate millions of traces a day. The focus is on trends, removing the actual parameters and grouping the queries by their structure. While in the Staging Environment usually every trace is generated by a QA test, therefore grouping the data has no meaning. Instead, the developers are focused on individual errors
- Personal Identifiable Information (PII) The Production Environment contains sensitive data. The traces should secure the data by obfuscation of the PII. The Staging Environment can show the data as is.
- Performance The Production Environment contains the actual durations. The Trace can show the exact duration of each span. A good monitoring system of the Production Environment also shows the correlation of the traces with other metrics such as CPU and number of open connections. The Staging Environment is usually much smaller and the duration has no meaning. Instead, the trace should contain the execution plan too for a deep DB analysis before deploying a new version, to prevent DB-related problems from hitting Production.
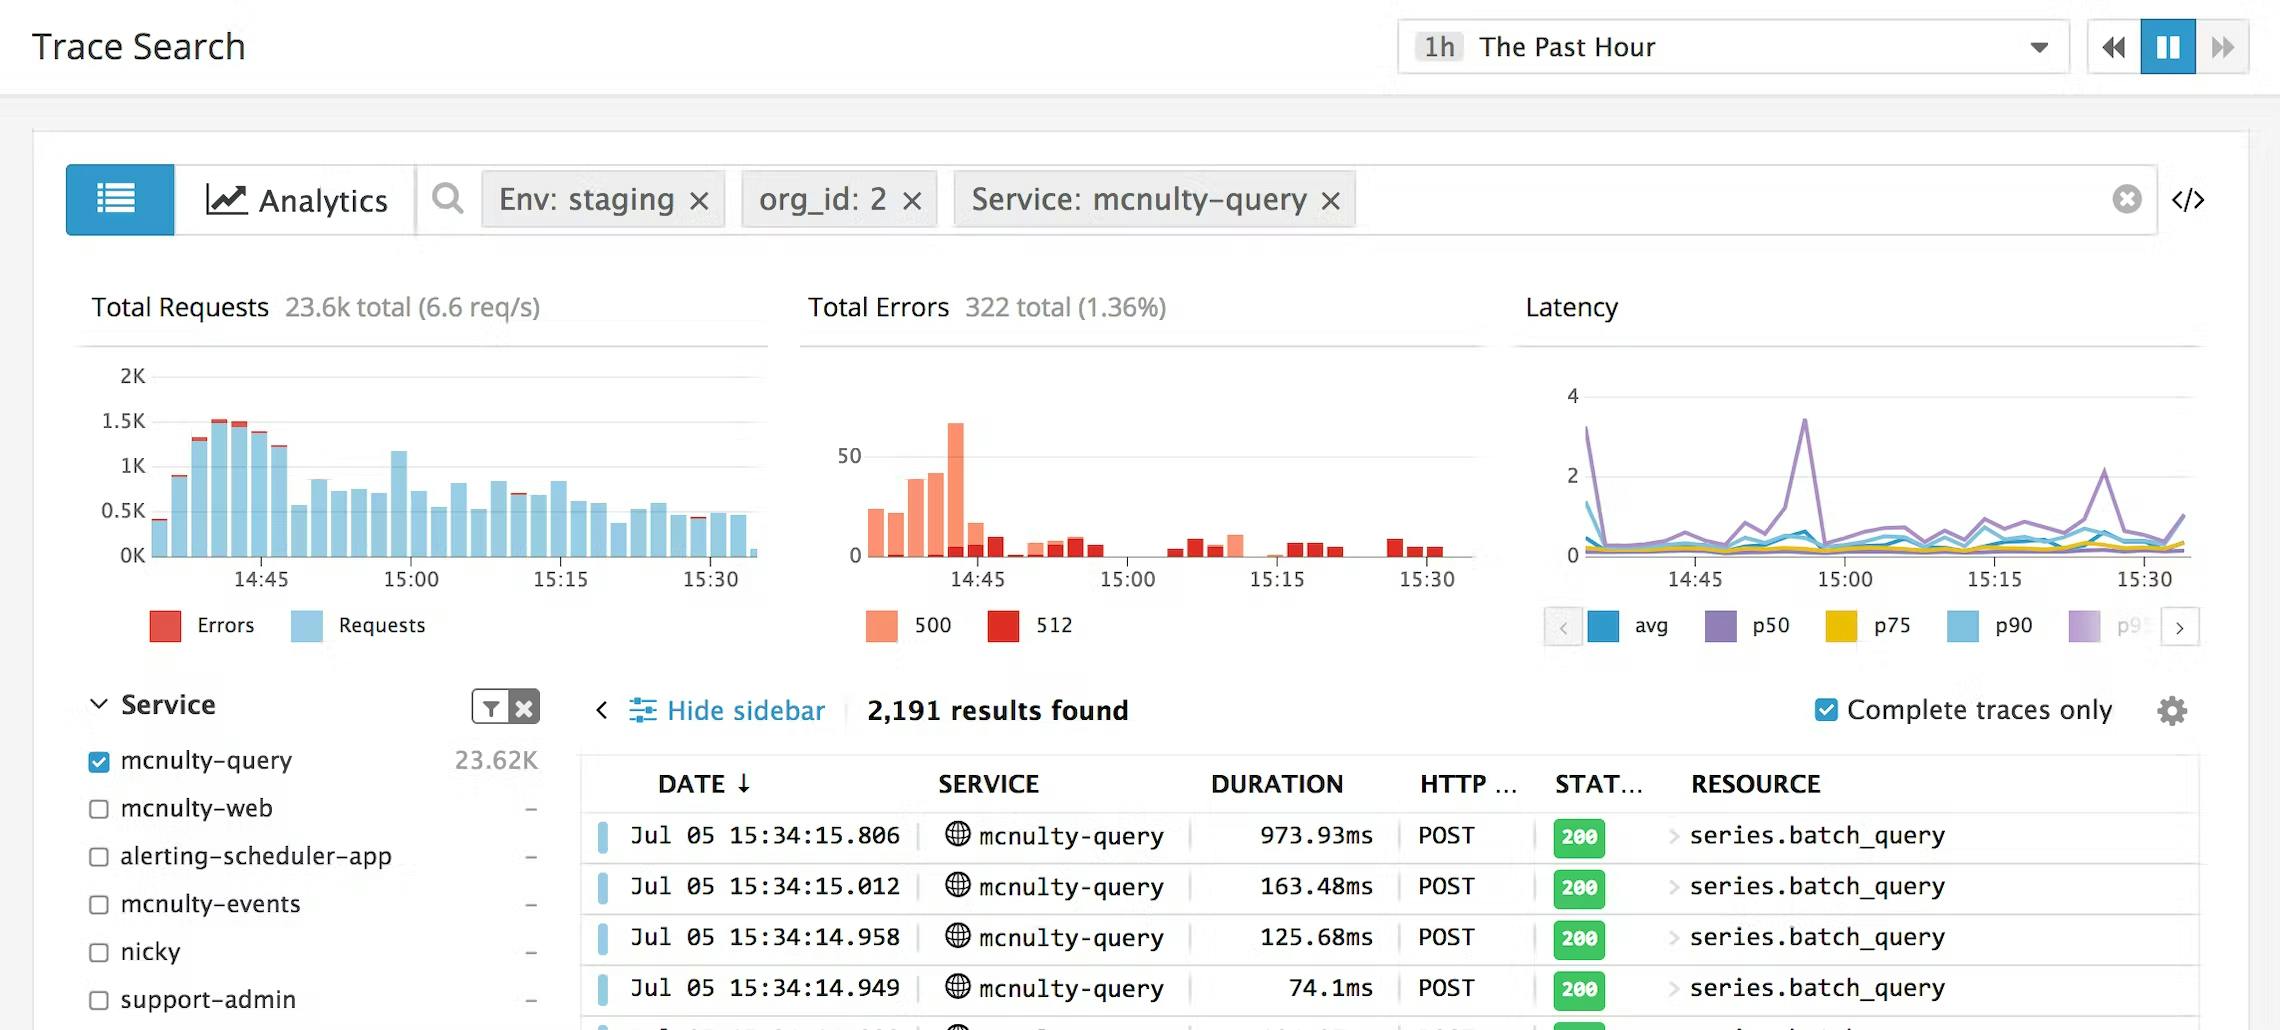
DataDog APM for monitoring traces of the Production Environment.
Trace Details
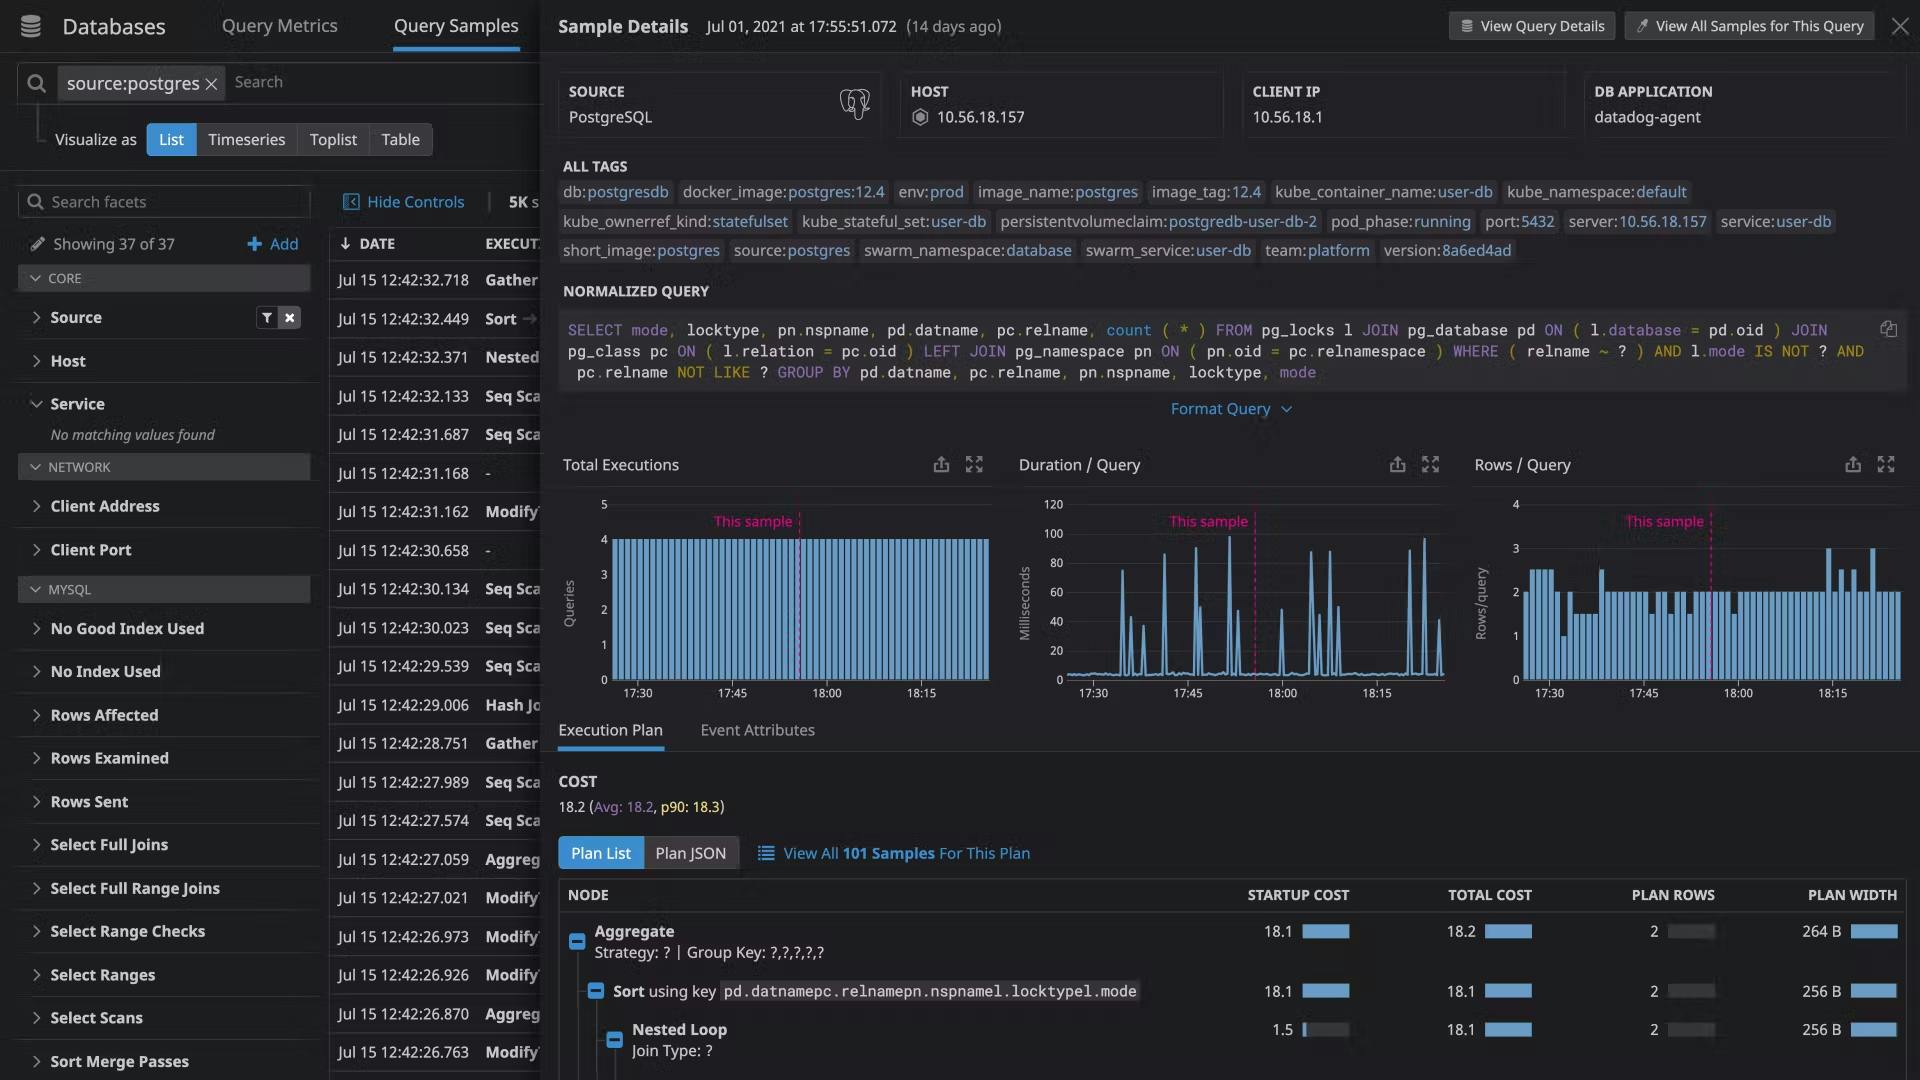
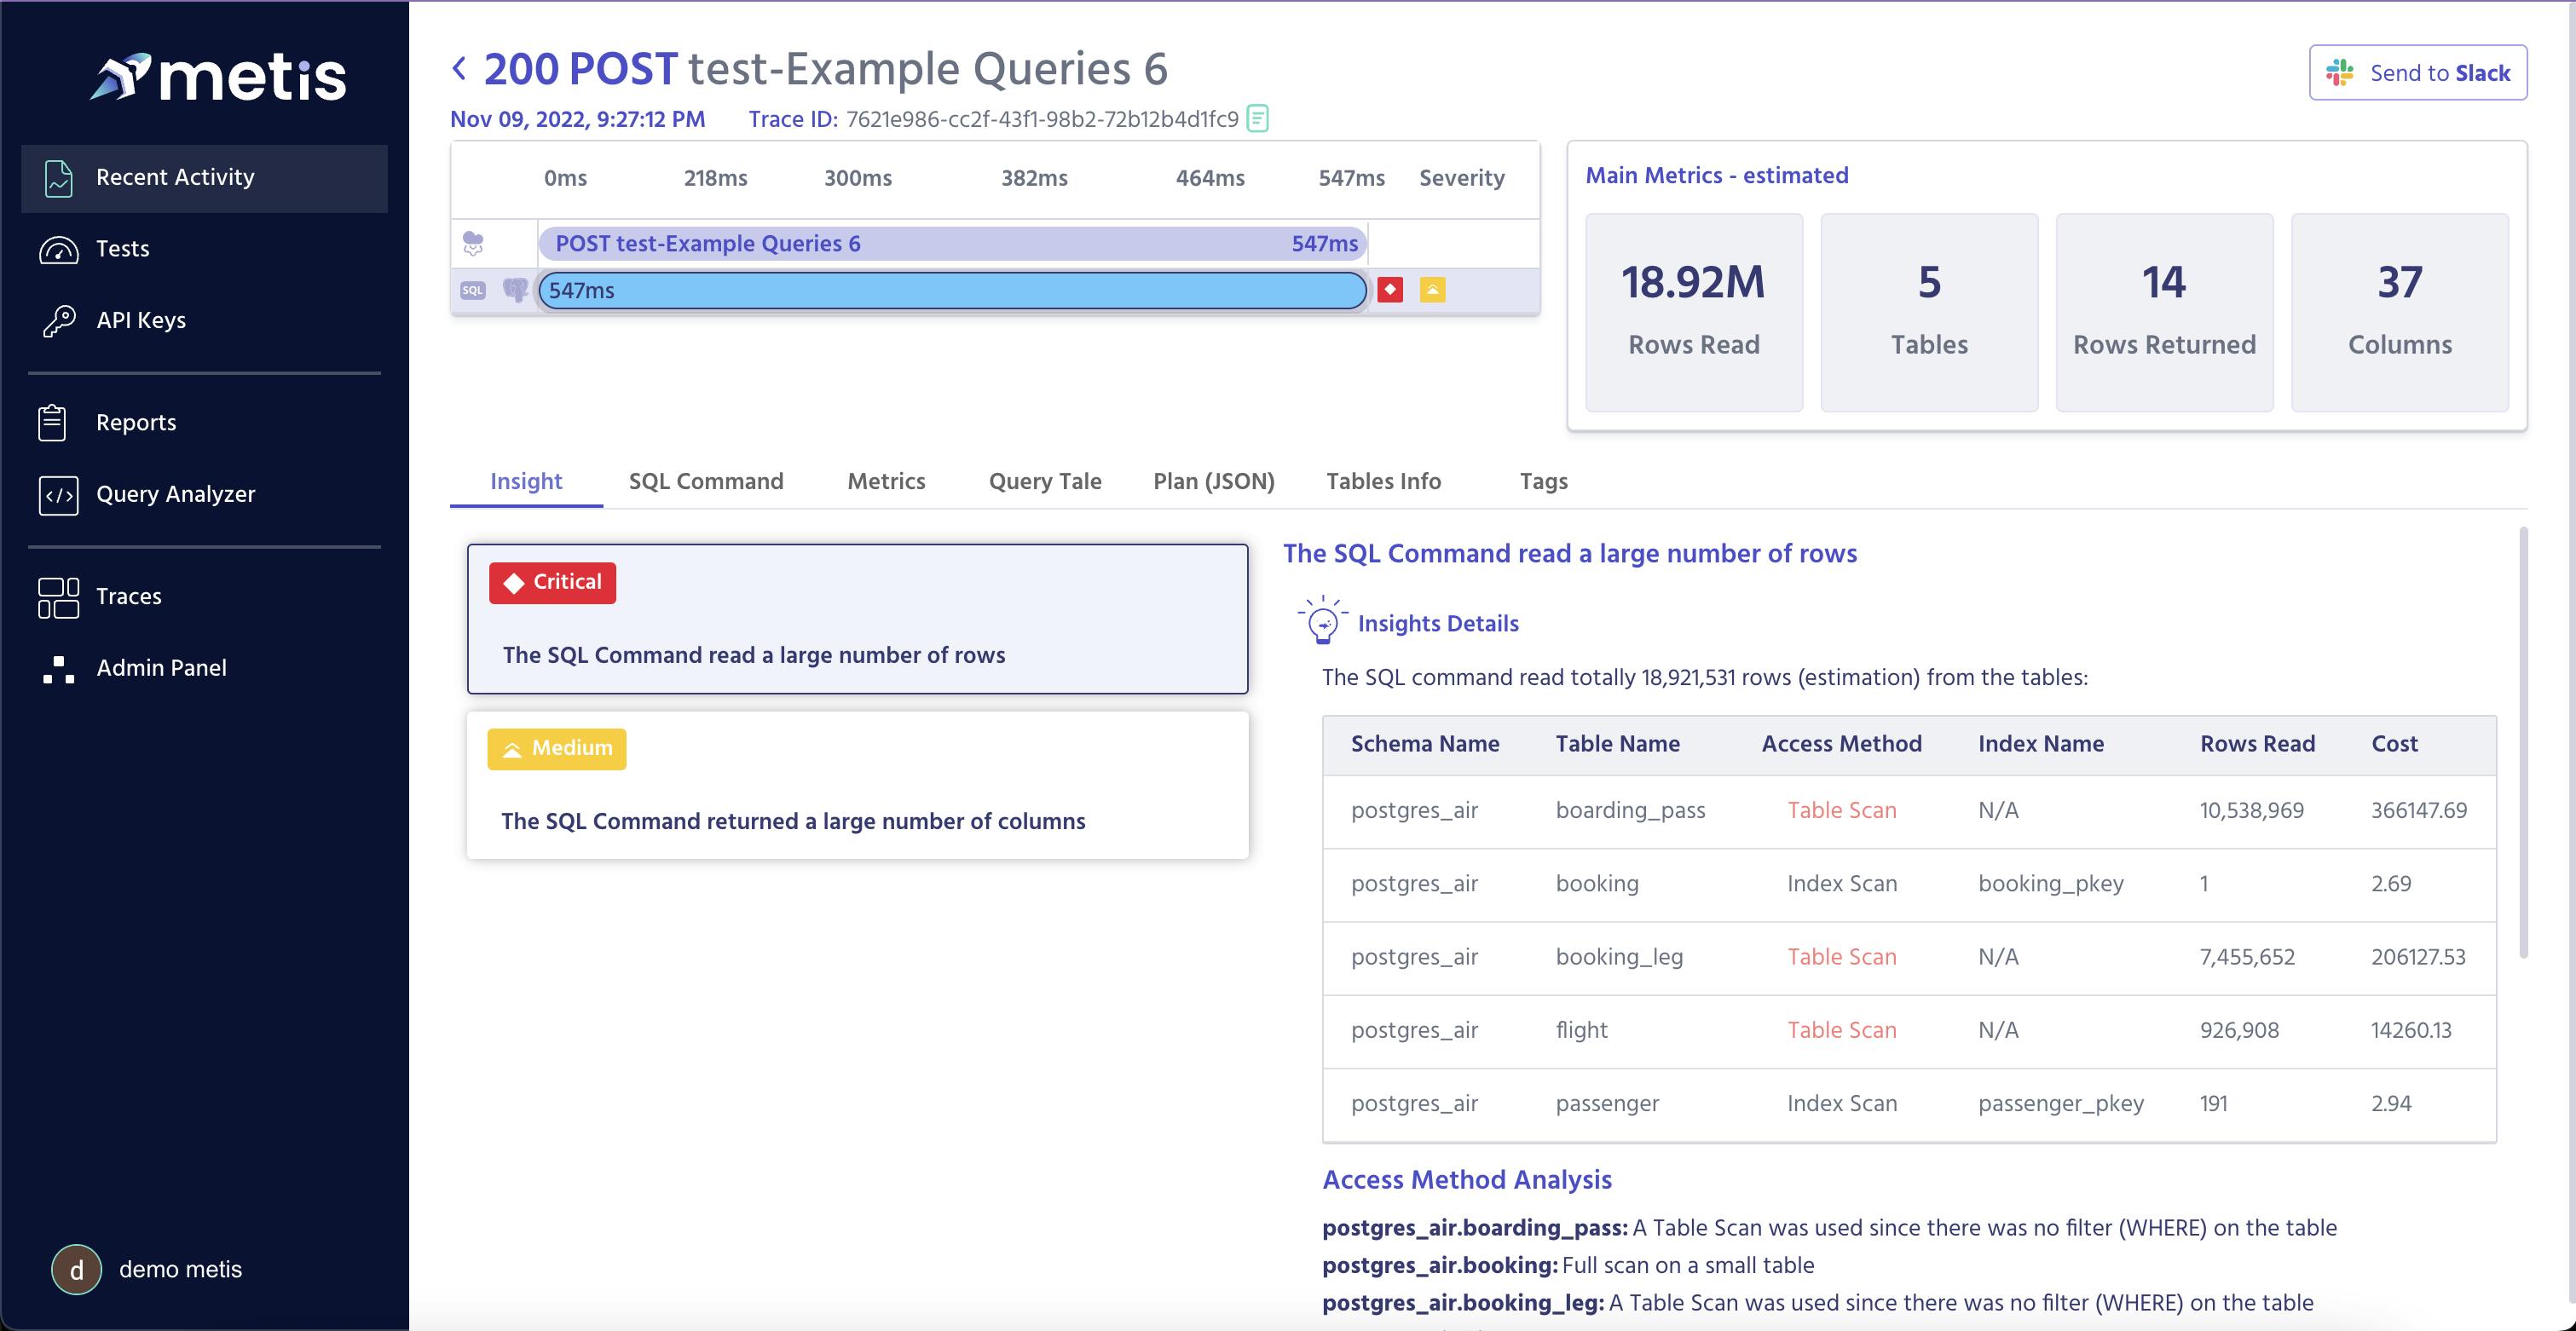
Deep DB-Related Analysis of a Trace
Get the important metadata in a glance:
- How many rows are read to generate the query? Inefficient queries read many rows and discard them.
- How big is the returned results set: many columns, JSONs, many rows, long text, or images?
The image was taken using Metis DB Observability platform
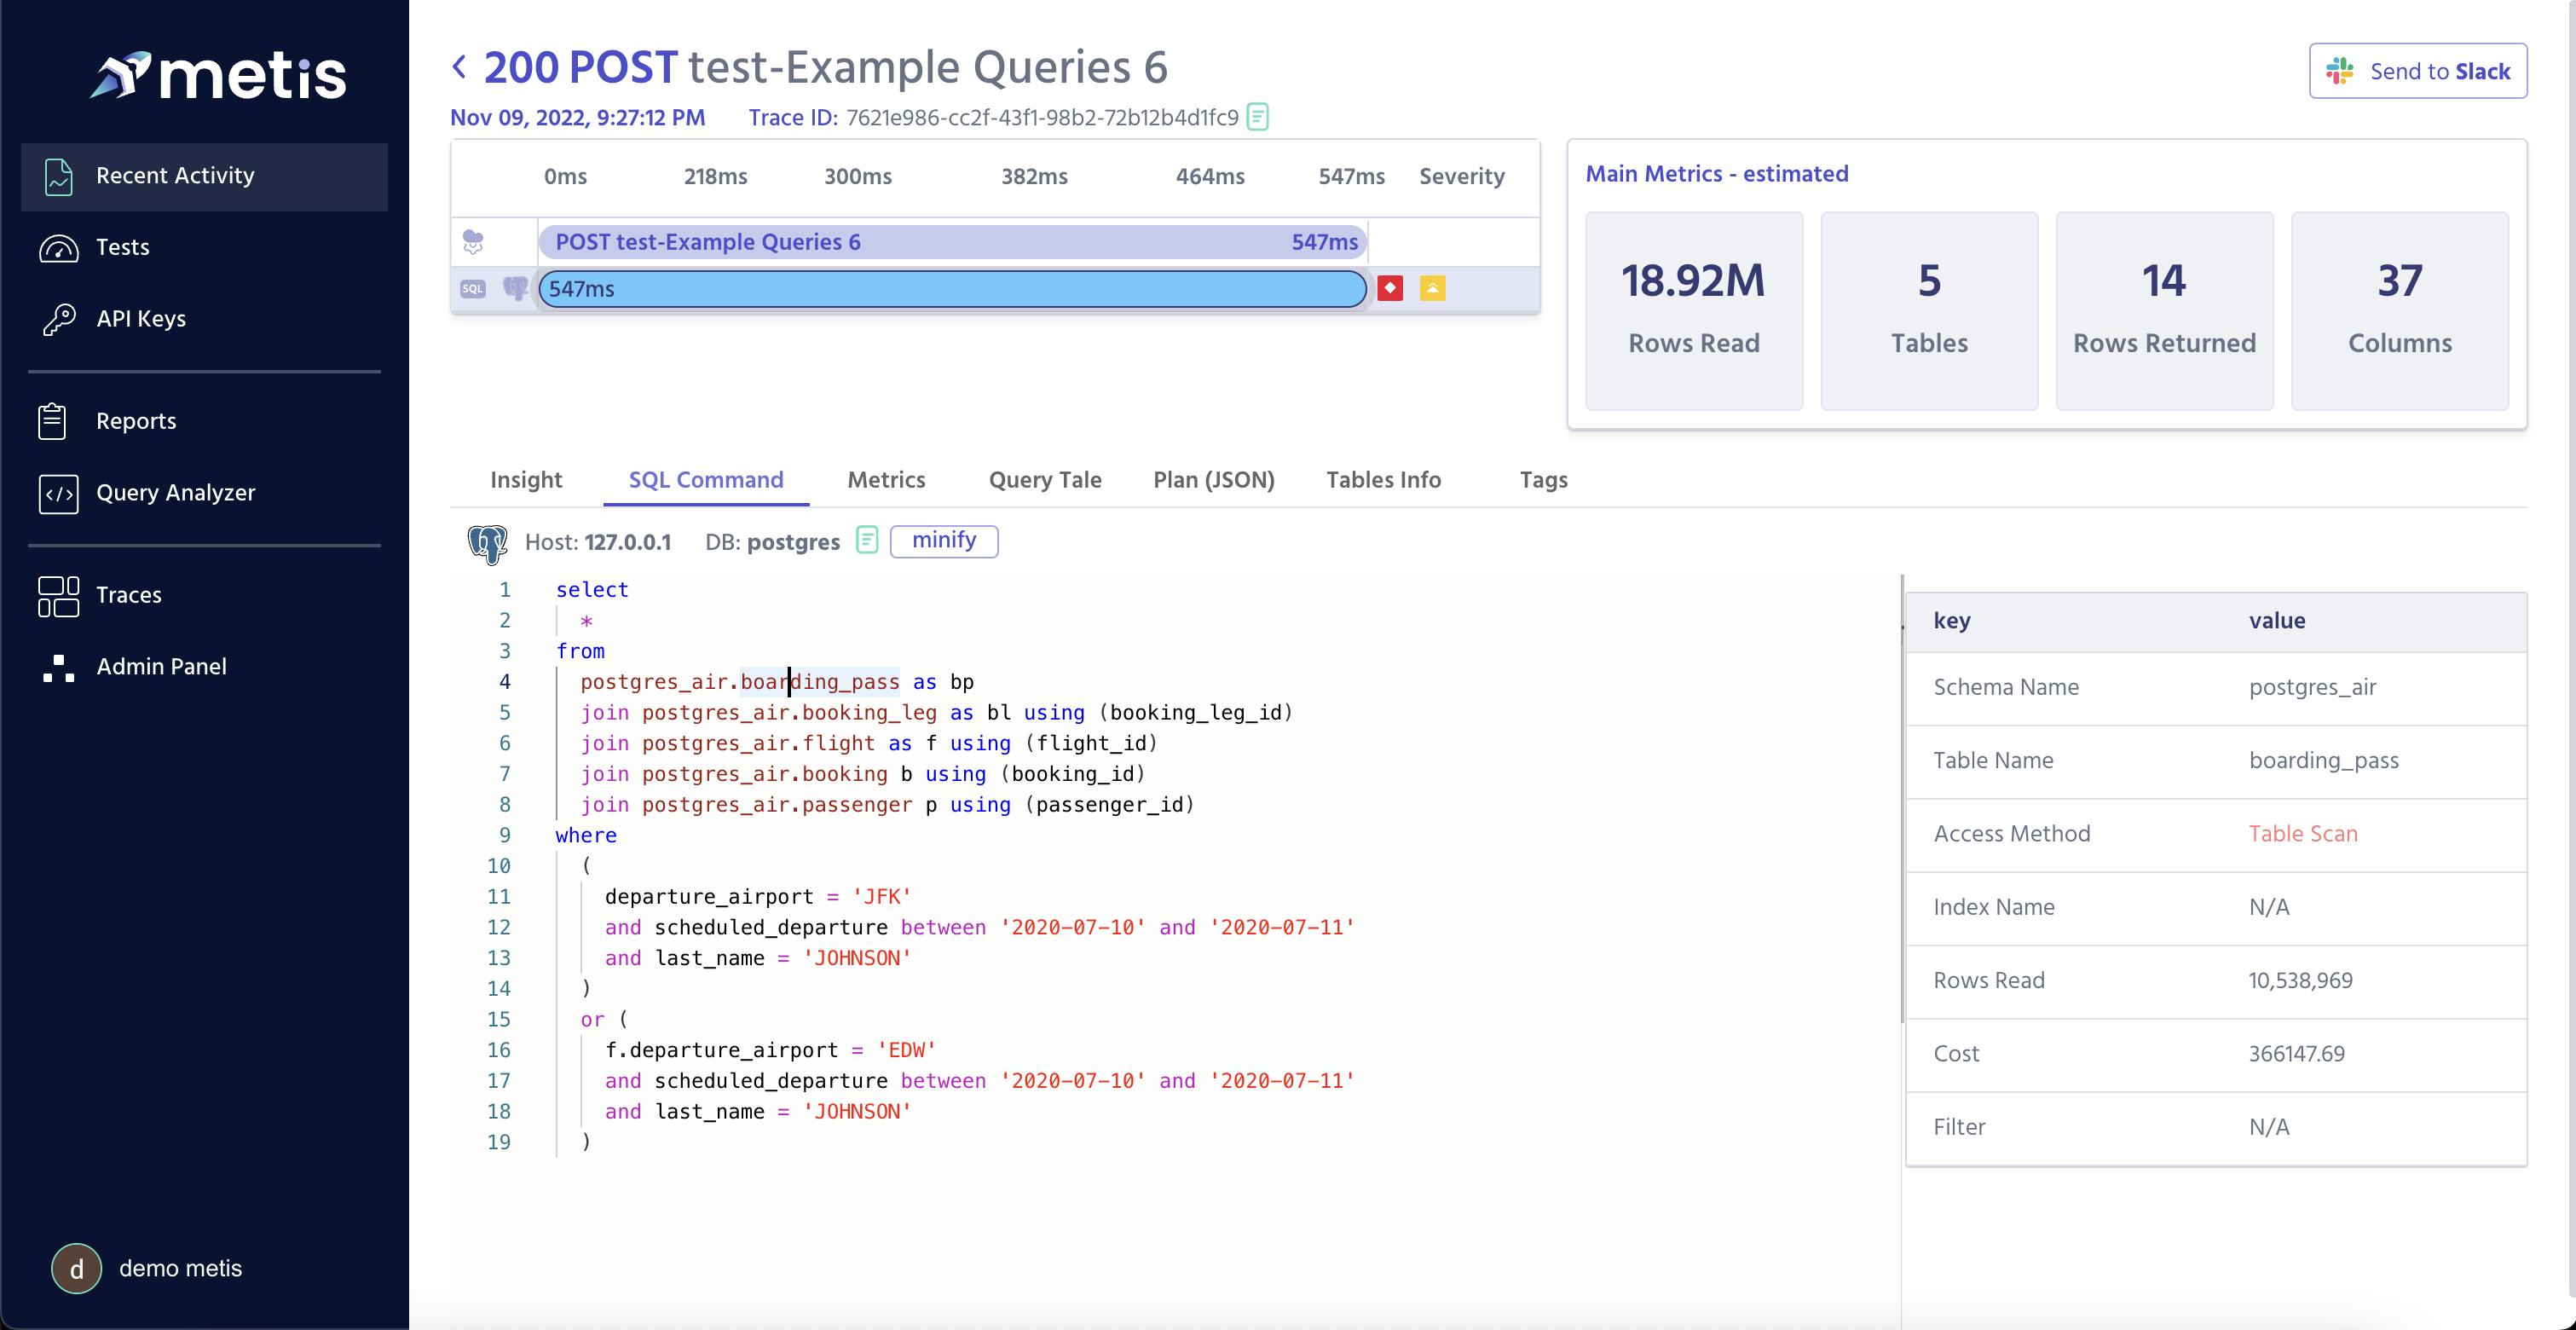
View the SQL command. Click on a table to view the part of the execution plan related to that table.
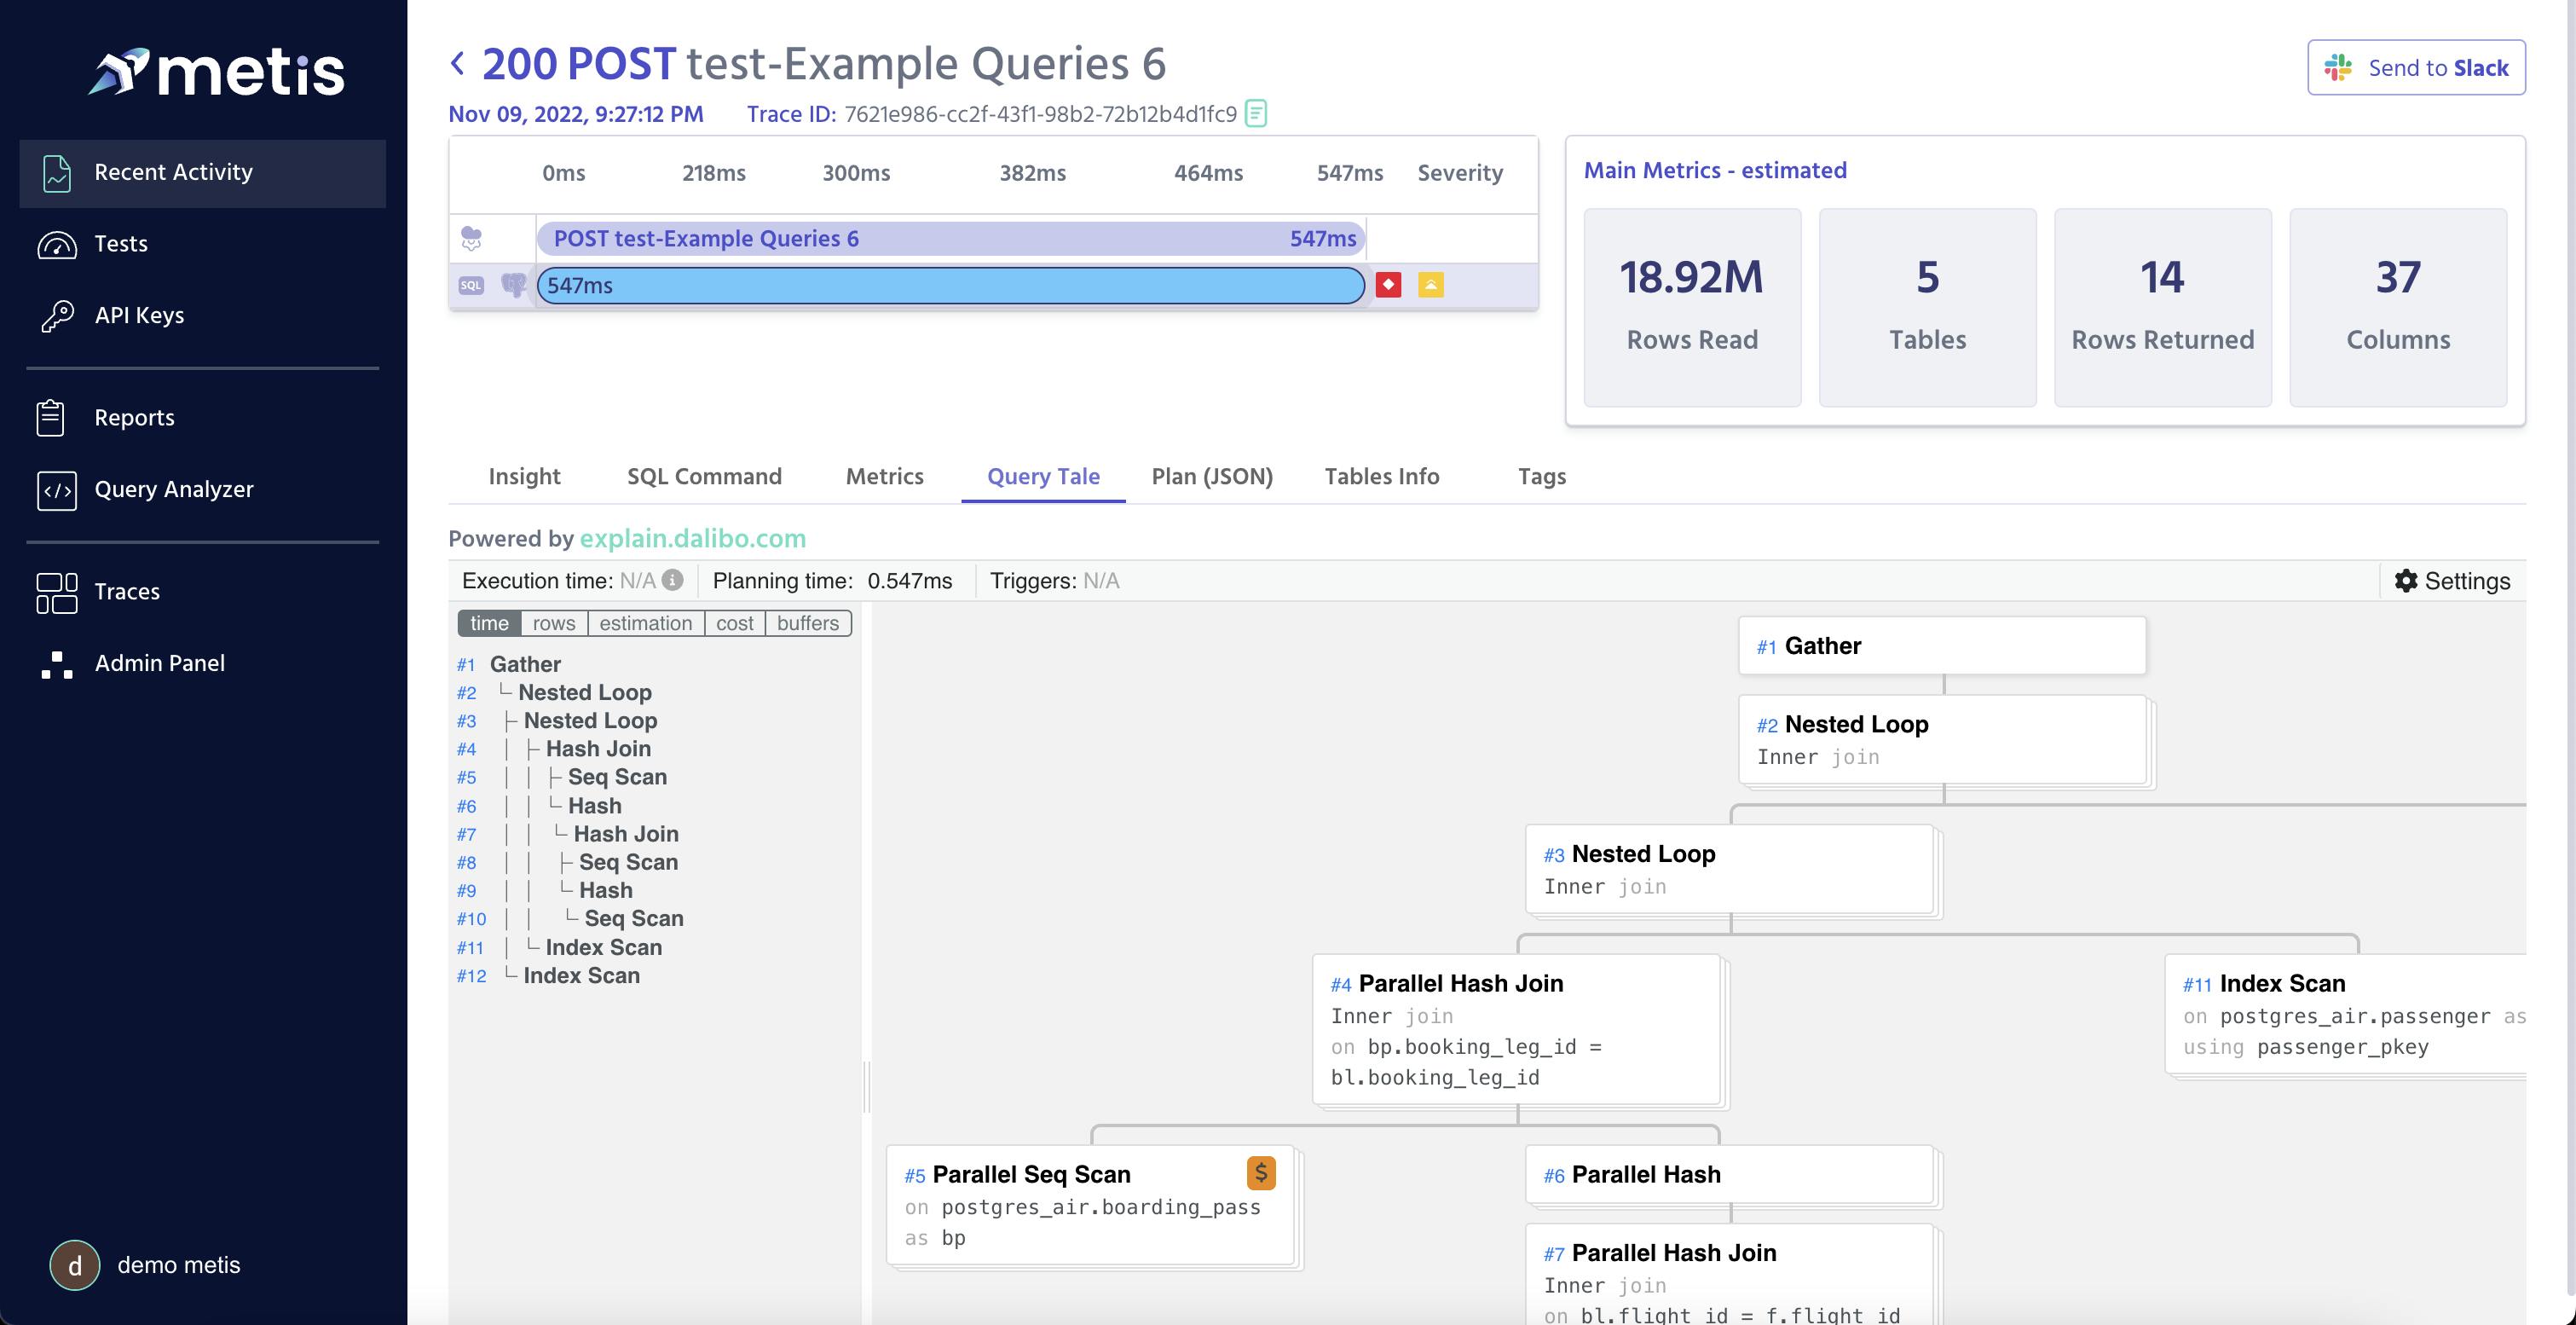
 View the execution plan
Conclusion
Distributed traces are super important for a good observability of your app. You probably know that already. OpenTelemetry SDK simplifies the instrumentation of the distributed traces and it is strongly recommended to start using it.
While all main APM vendors support trace analysis, with or without OpenTelemetry, analyzing the SQL commands requires other tools designed for a deep analysis at scale. Metis is one of those tools. It has a generous free tier so you can start using it today.
Resources
datadoghq.com/knowledge-center/distributed-.. thecloudblog.net/post/opentelemetry-in-acti.. aspecto.io/blog/getting-started-with-opente.. newrelic.com/blog/how-to-relic/distributed-.. metisdata.io - Prevent DB-related problems from hitting the Production Environment.