Reading Postgres Execution Plans doesn't have to be so complicated
Great tools can help you easily find what went wrong
By Itay Braun, CTO, Metis
Main Subjects
- What is an Execution Plan. Key differences between the Actual and Estimated ones.
- As a backend developer, why should you care, even if an ORM is used and you don't control the SQL.
- A curated list of great tools that can help a lot.
Why should I care?
The SQL commands you wrote, or the ones created automatically by an ORM (Sequelize, SQLAlchemy, Hibernate...) might not be efficient, making the app slow and causing a bad user experience. Everything might look great in the performance tests on the Staging Environment but super slow in the Production one, as many inefficient queries lock too many rows (a classic concurrency problem). To understand how the DB engine executes the SQL and where the bottlenecks are, you’ll have to Get the execution plan (actual or estimated)
What is an SQL Execution Plan?
In the Postgres documentation: The execution plan shows how the table(s) referenced by the statement will be scanned — by plain sequential scan, index scan, etc. — and if multiple tables are referenced, what join algorithms will be used to bring together the required rows from each input table.
In other words, the SQL command only tells the database what data to bring but it doesn’t tell the DB how to fetch this data. This is by design, as every database has a good query optimizer to make the decisions about which indexes to use, in what order to join the tables, and how exactly to join them.
Can you give me 3 real-world examples?
- The query scans the entire table and doesn’t use any index. You might create an index and expect the DB engine to use it, but it doesn't.
- The query is inefficient. Maybe you wrote it manually or maybe an ORM created it. Either way, the fact it runs quickly on the small DB of the Staging Environment when all the data is in the cache (after you run a few QA tests) doesn’t mean it will perform well in the Production Env. The plan shows the “cost” in terms of CPU and IO so you can understand how it will perform on a much larger DB.
- An UPDATE or DELETE command changes too many rows which might indicate you’ll have a data-related problem.
What are the Differences between the Actual and the Estimated Plans
There are two types of execution plans: Actual and Estimated.
The Actual Execution Plan shows the real calculations and steps executed by the DB. Since the Actual Execution Plan show accurate data, it is recommended to use it for troubleshooting.
Notice, the DB, as the name suggests, actually runs the query. So if you want to understand why exactly it took a query 10 minutes to run, getting the actual plan probably would take another 10 minutes. Or, if the SQL commands try inserting new rows, when running it again to get its execution plan, new rows will be added and you might get PK violation errors.
The Estimated Execution Plan shows the approximate calculations. It is very fast to generate, usually under a few milliseconds. The DB engine uses statistics about the data distribution of each column to generate the best execution plan. In rare scenarios the statistics used by the DB engine are out of date, therefore a suboptimal plan is generated. Fixing this problem is not in the scope of this post.
How to Postgres Generates Execution Plans
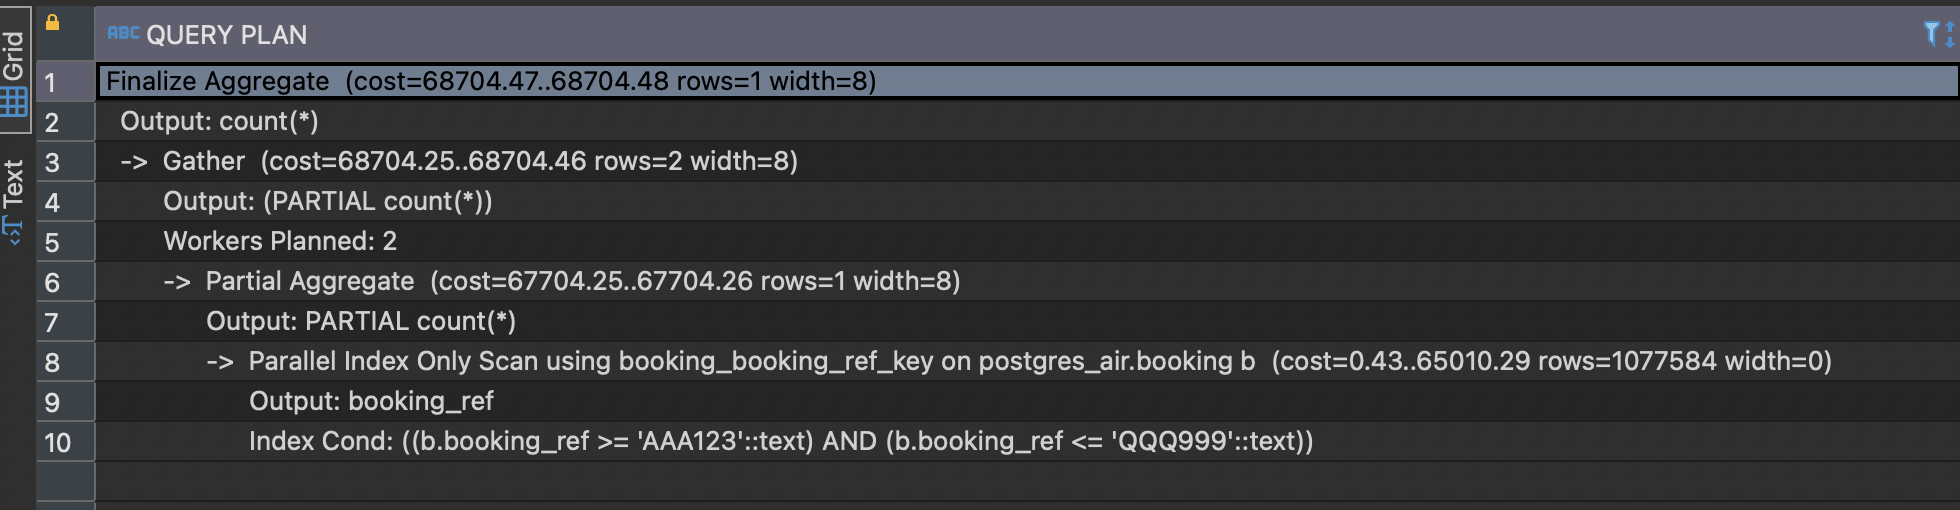
You can use the command EXPLAIN to generate an actual or estimated plan. For ex.
EXPLAIN ( COSTS, VERBOSE, BUFFERS, FORMAT JSON)
SELECT count(*)
FROM postgres_air.booking b
WHERE booking_ref between 'AAA123' and 'QQQ999'
The EXPLAIN command expects several parameters, covered in the official PG documentation. We won't discuss them here. The main options you should know are:
- To run the SQL command and get its actual command use EXPLAIN (ANALYZE) SELECT ….
- Use EXPLAIN (FORMAT JSON), with or without the other options, to return a detailed JSON rather than the default text. As you’ll see below, some very useful tools know how to “read” this JSON and visualize it.
An example of a textual visualizing of the Execution Plan
What Tools can I Use to Easily Read an Execution Plan?
The following tools can help with reading an execution plan and detect the most “expensive” steps in terms of CPU and IO.
- Dalibo
- Depesz EXPLAIN
- explain.tensor
- Metis
- pgAnalyze
- pgMustard
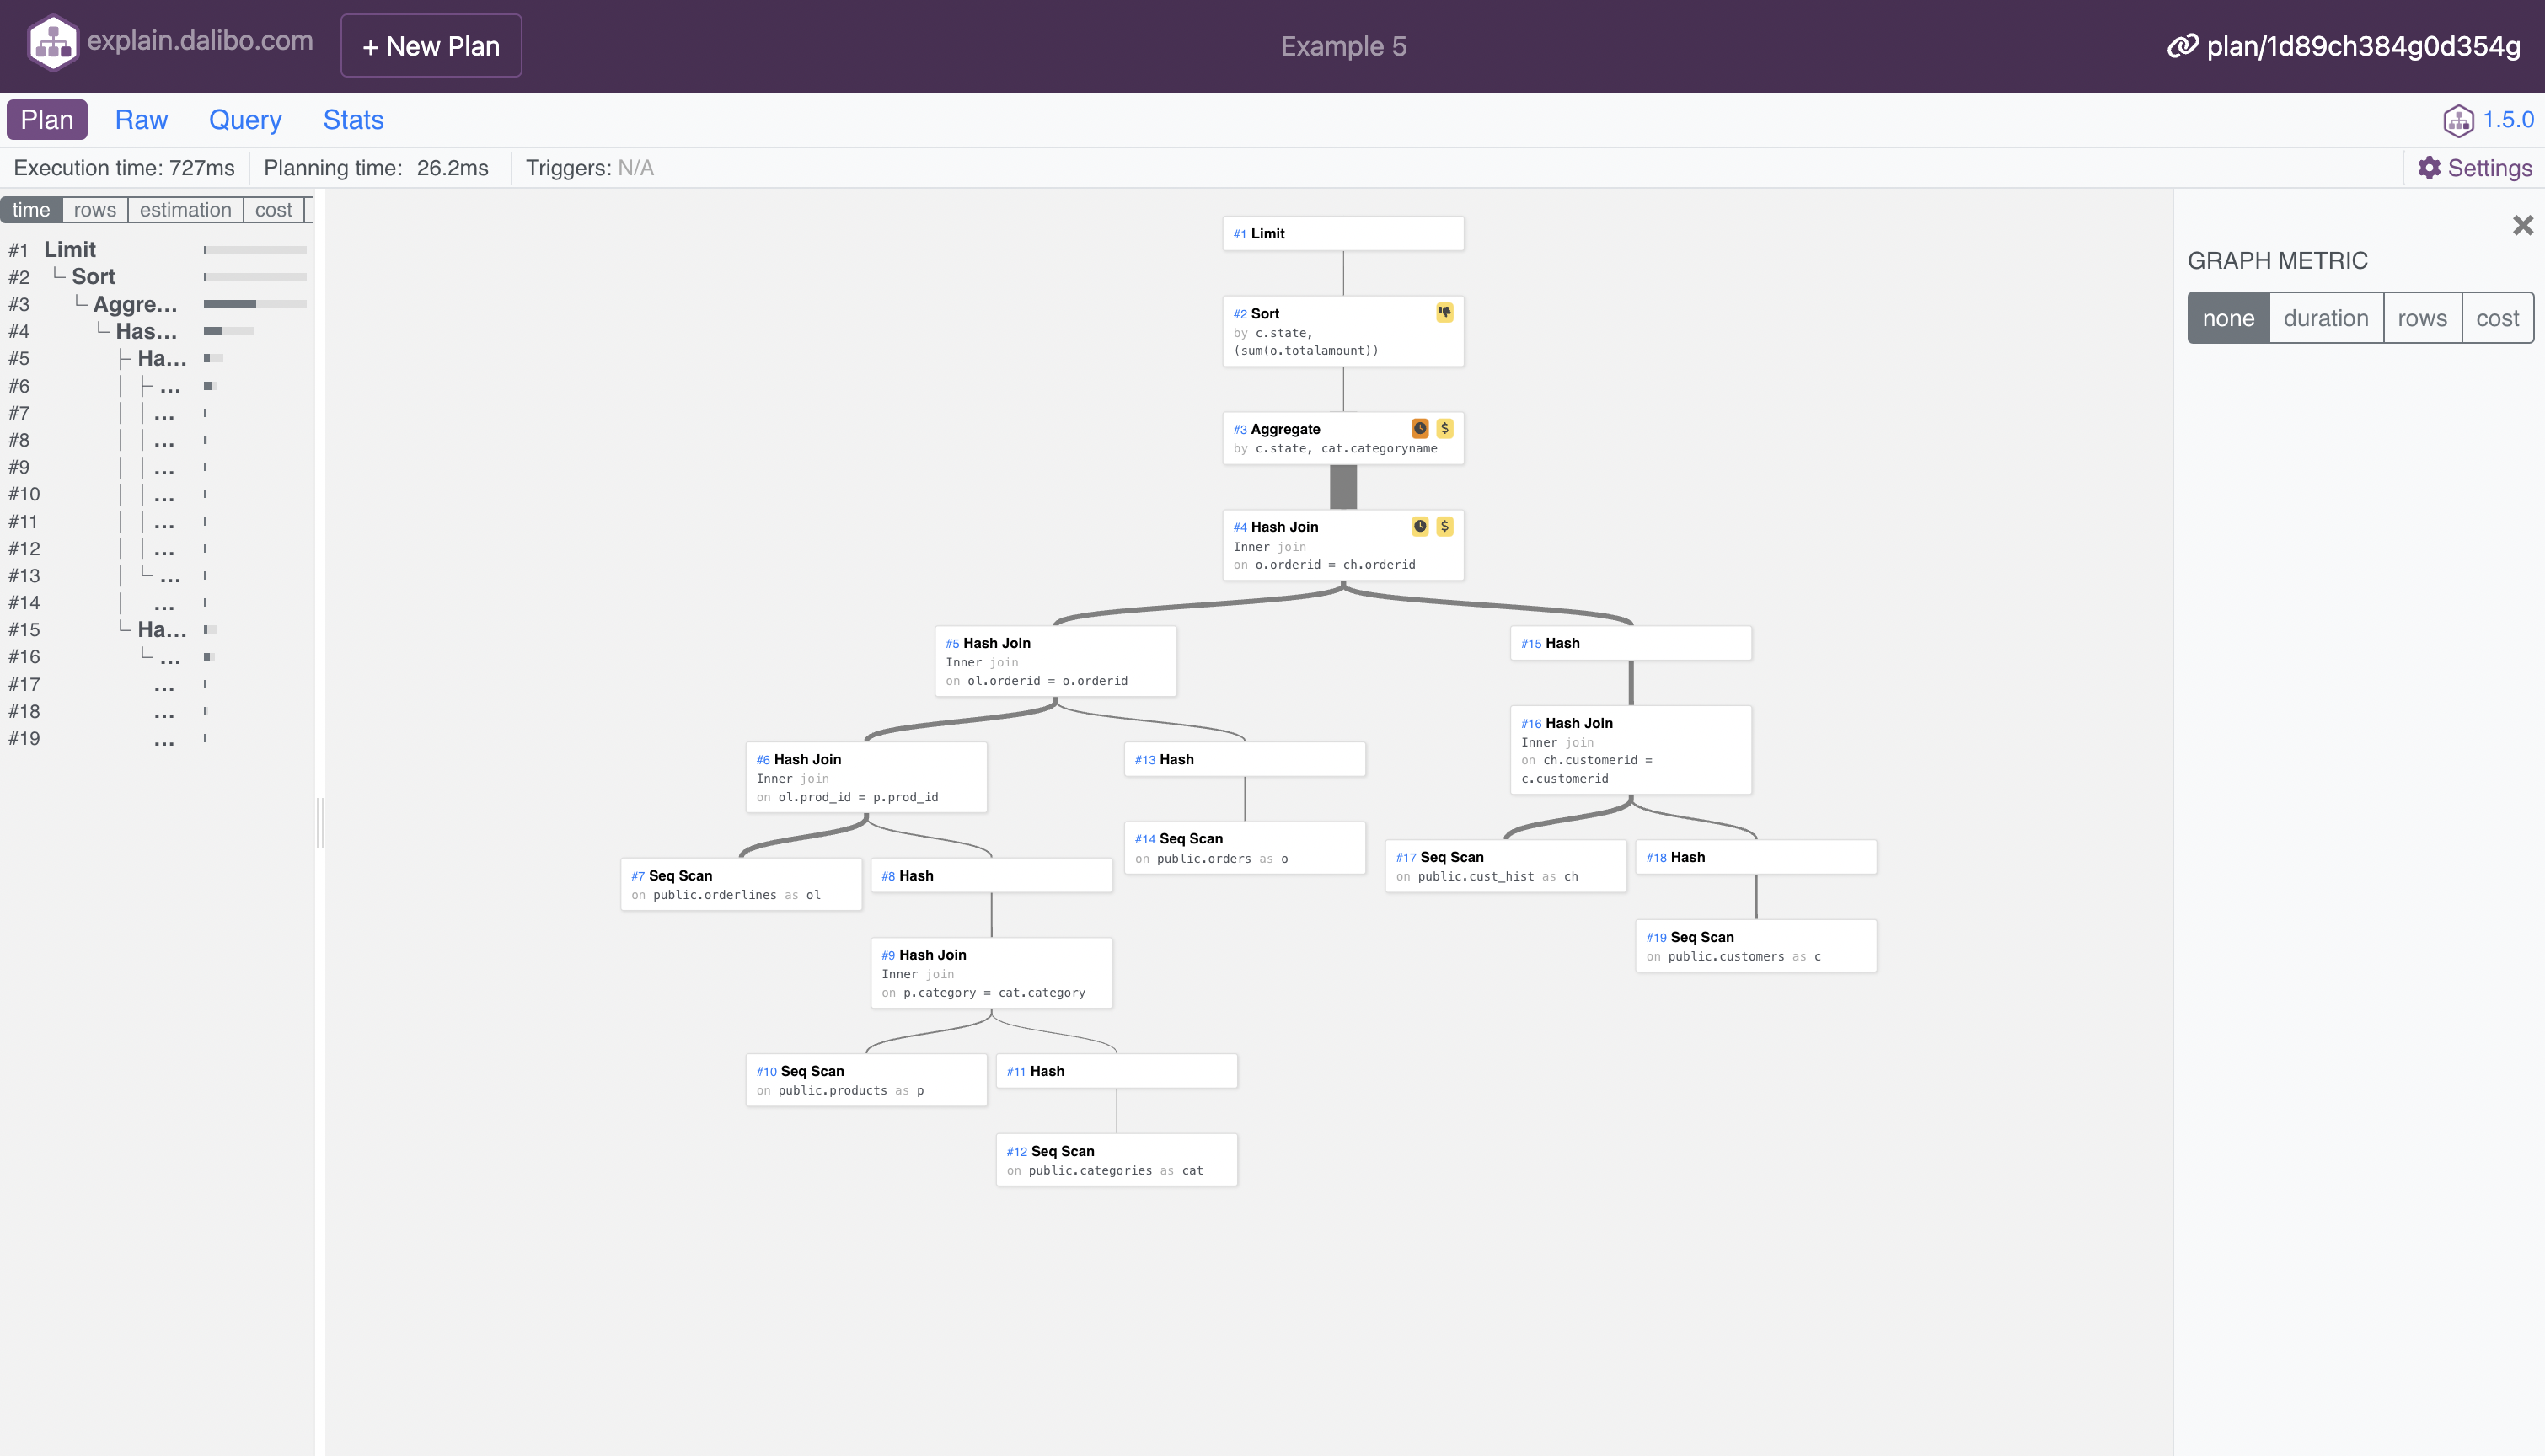
Explain.dalibo
- About: a simple and useful tool. Just paste the execution plan and the SQL (optional) to get a clear visualization of the steps. Click on a step to get more information.
- URL: https://explain.dalibo.com/
- Free Tier: Yes
- Open Source: Yes
- Recommendations on how to solve the problems: No
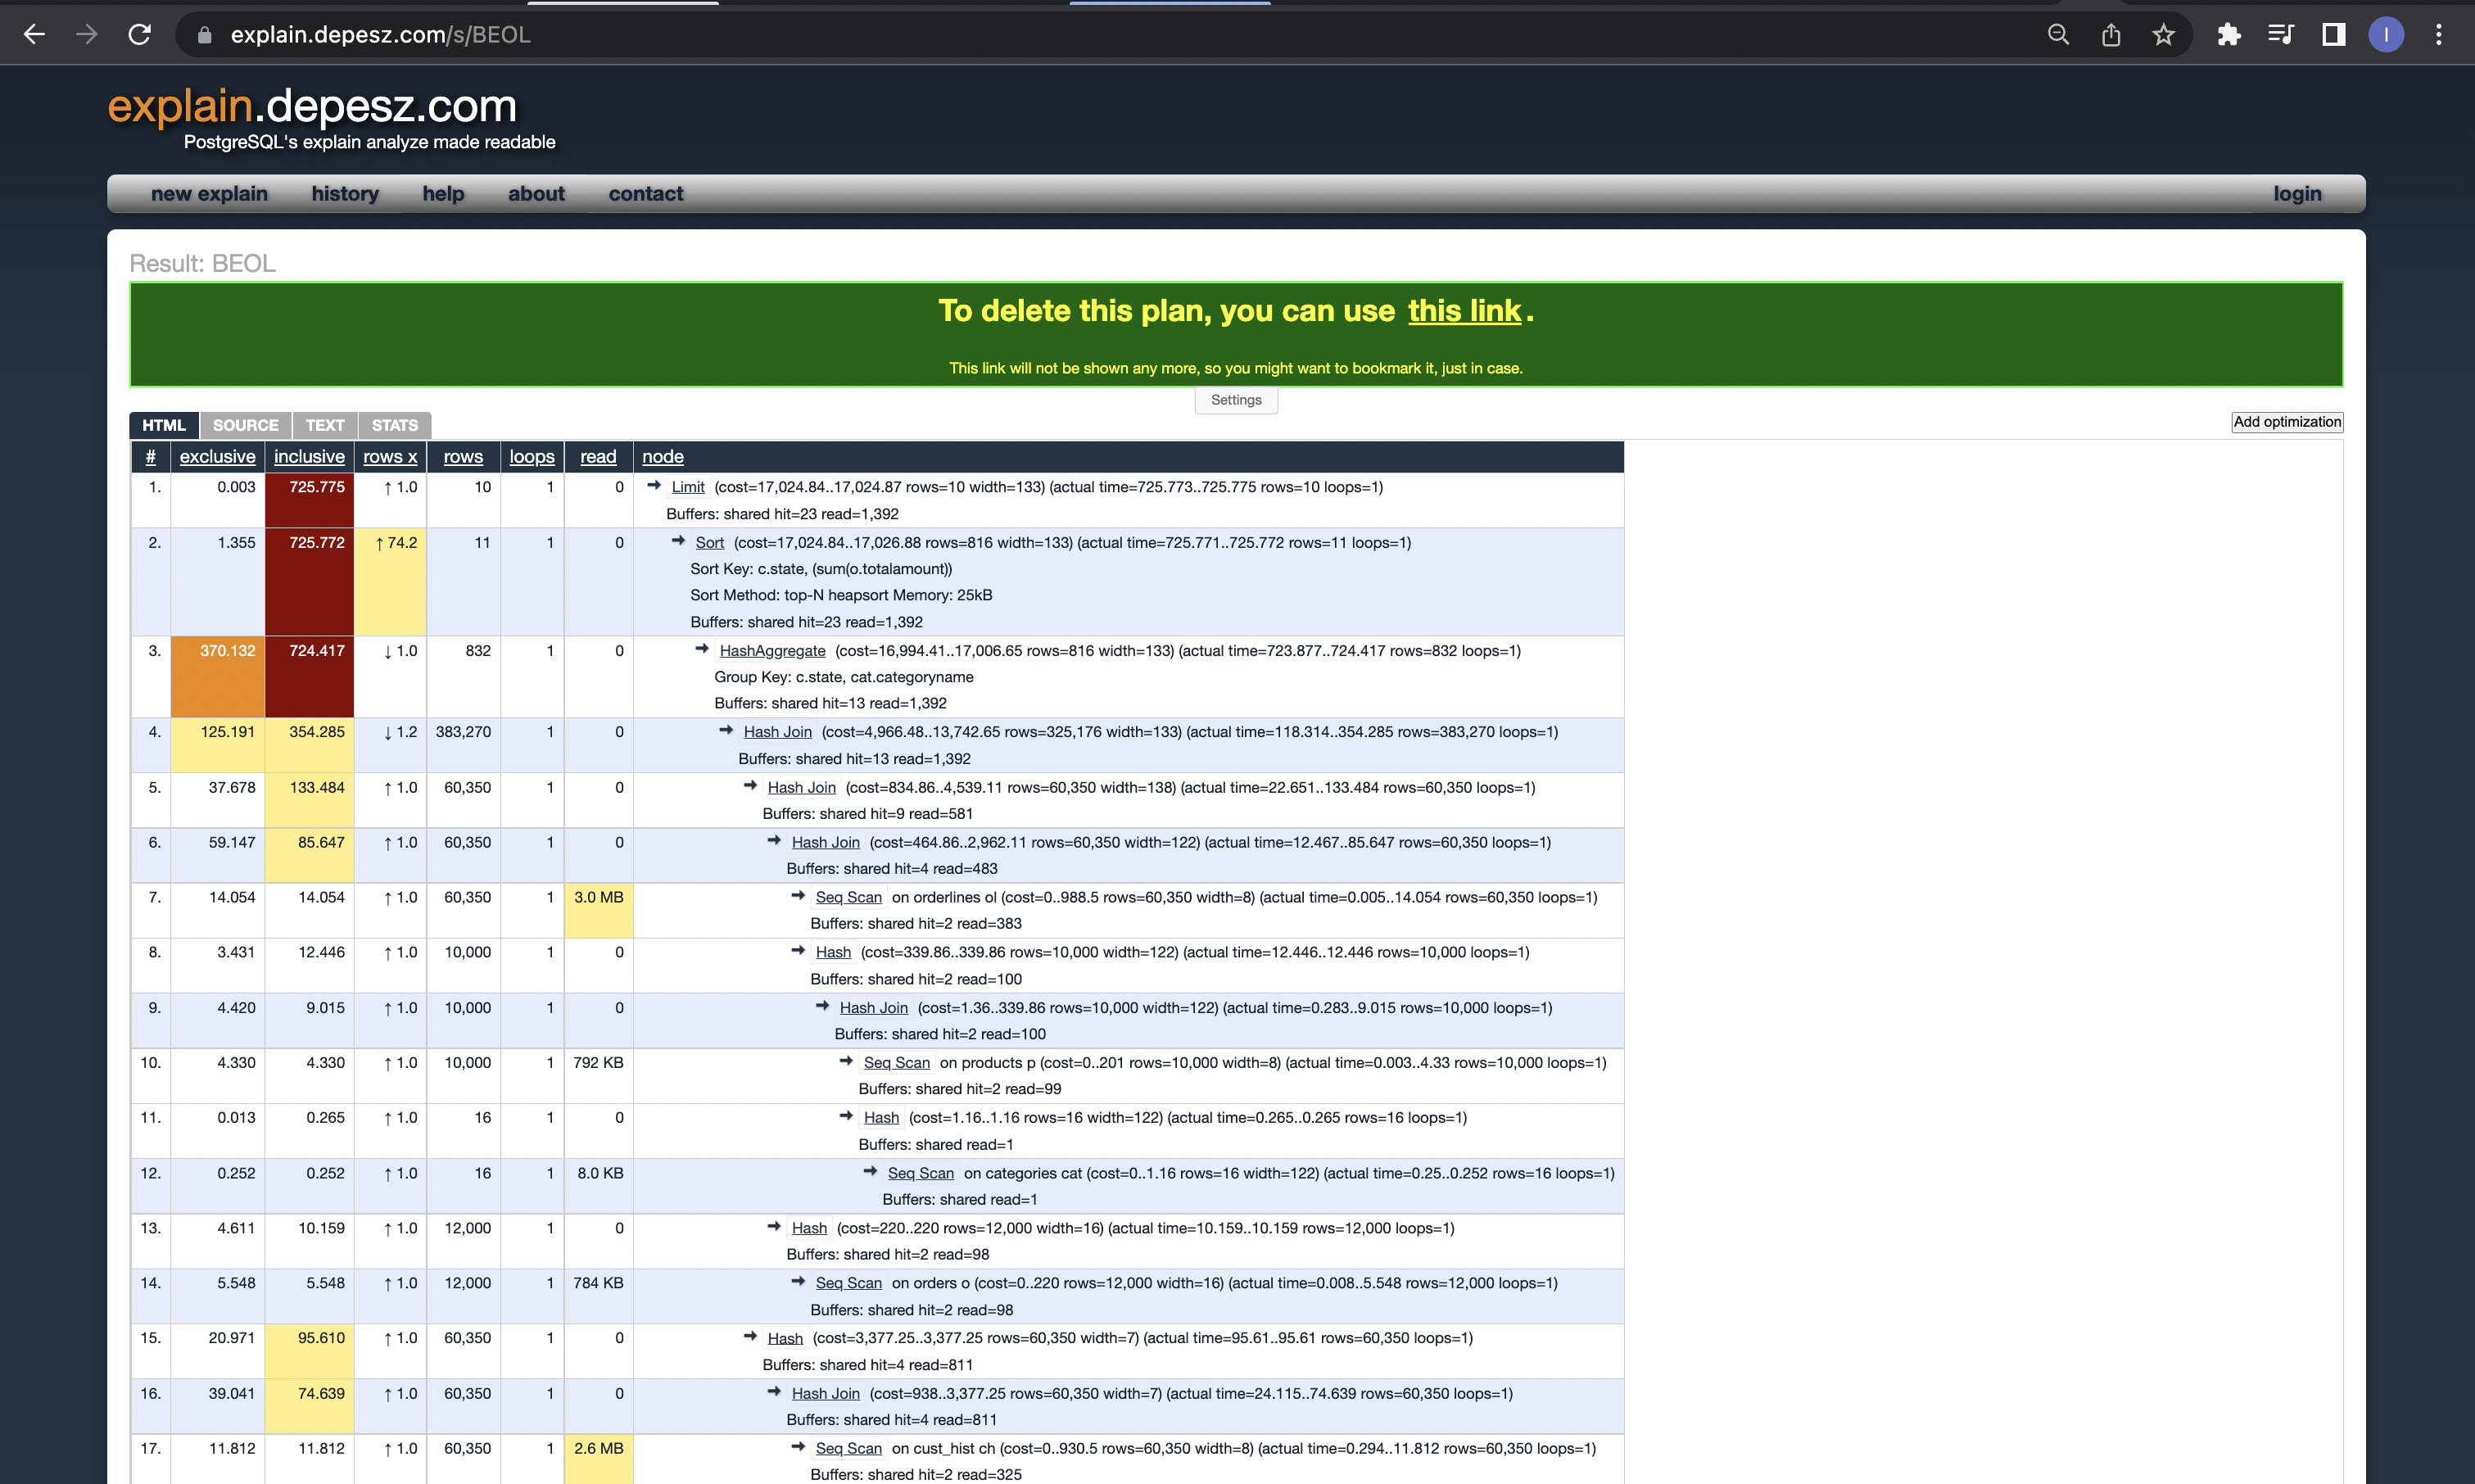
Depesz
- Desc: This tool shows the JSON as a table and highlights the expensive steps.
- URL: https://explain.depesz.com/
- Free Tier: Yes
- Open Source: No
- Recommendations on how to solve the problems: No
The execution plan used here is the same as the one used to show Dalibo above.
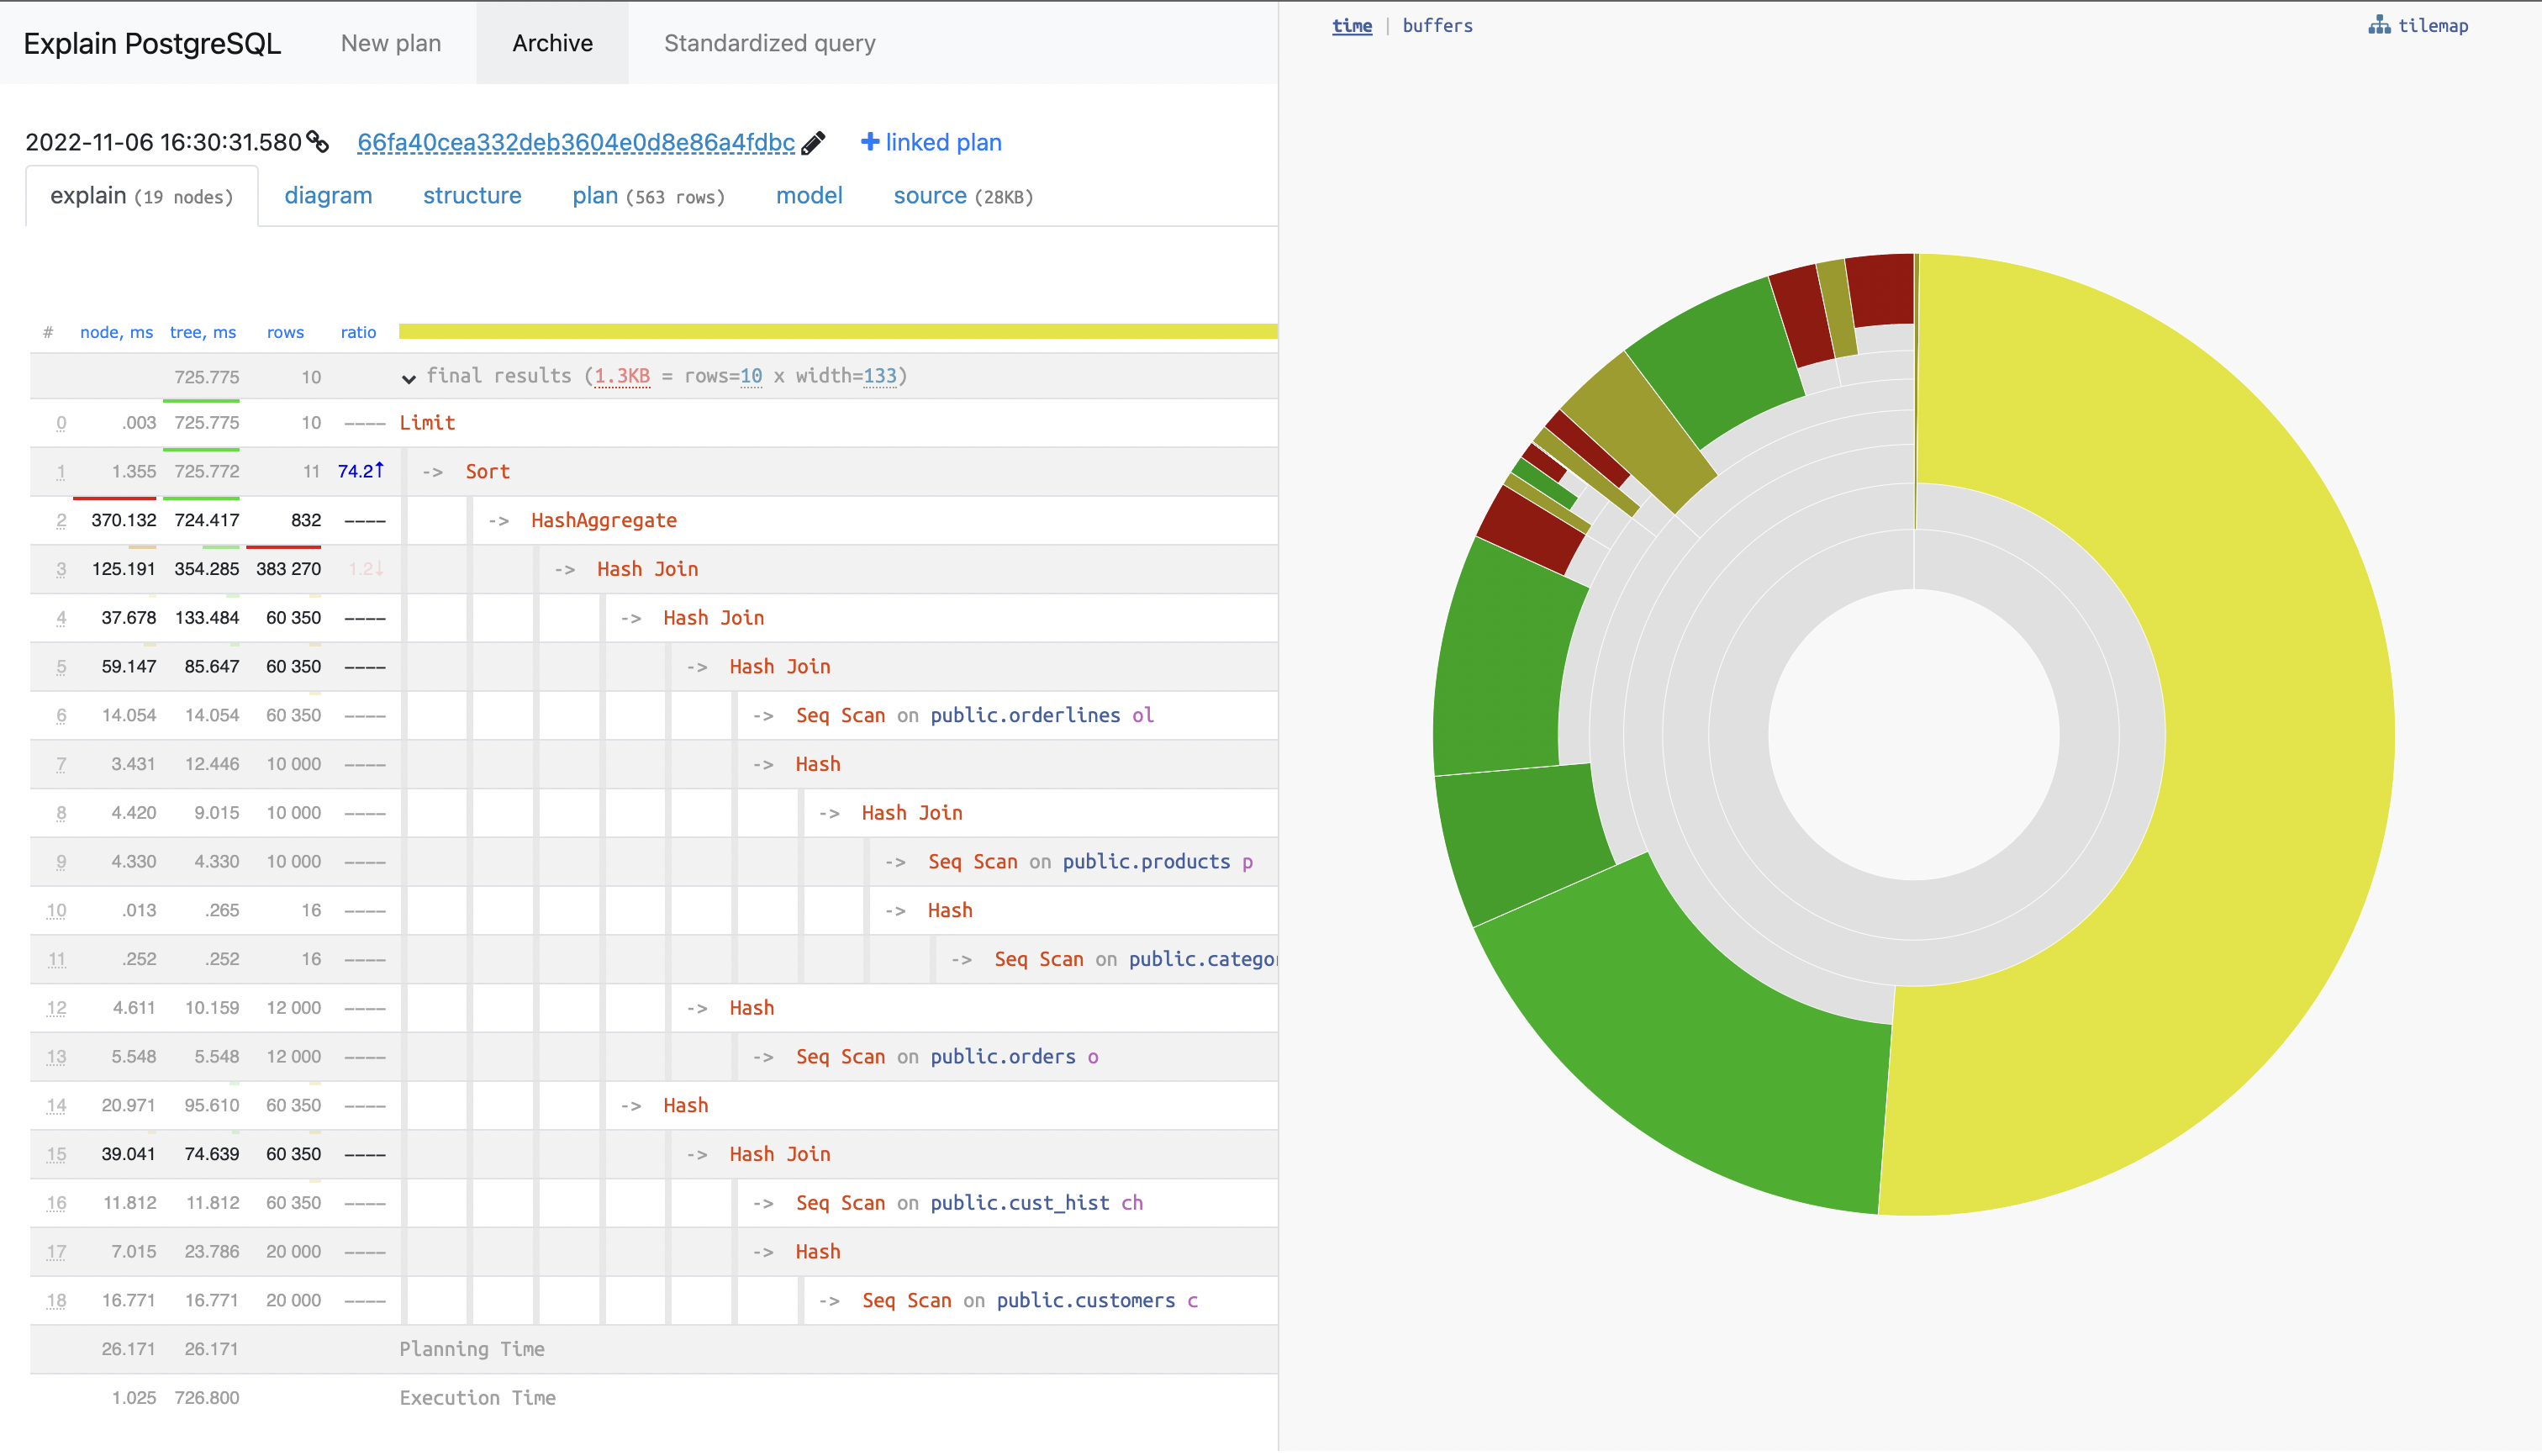
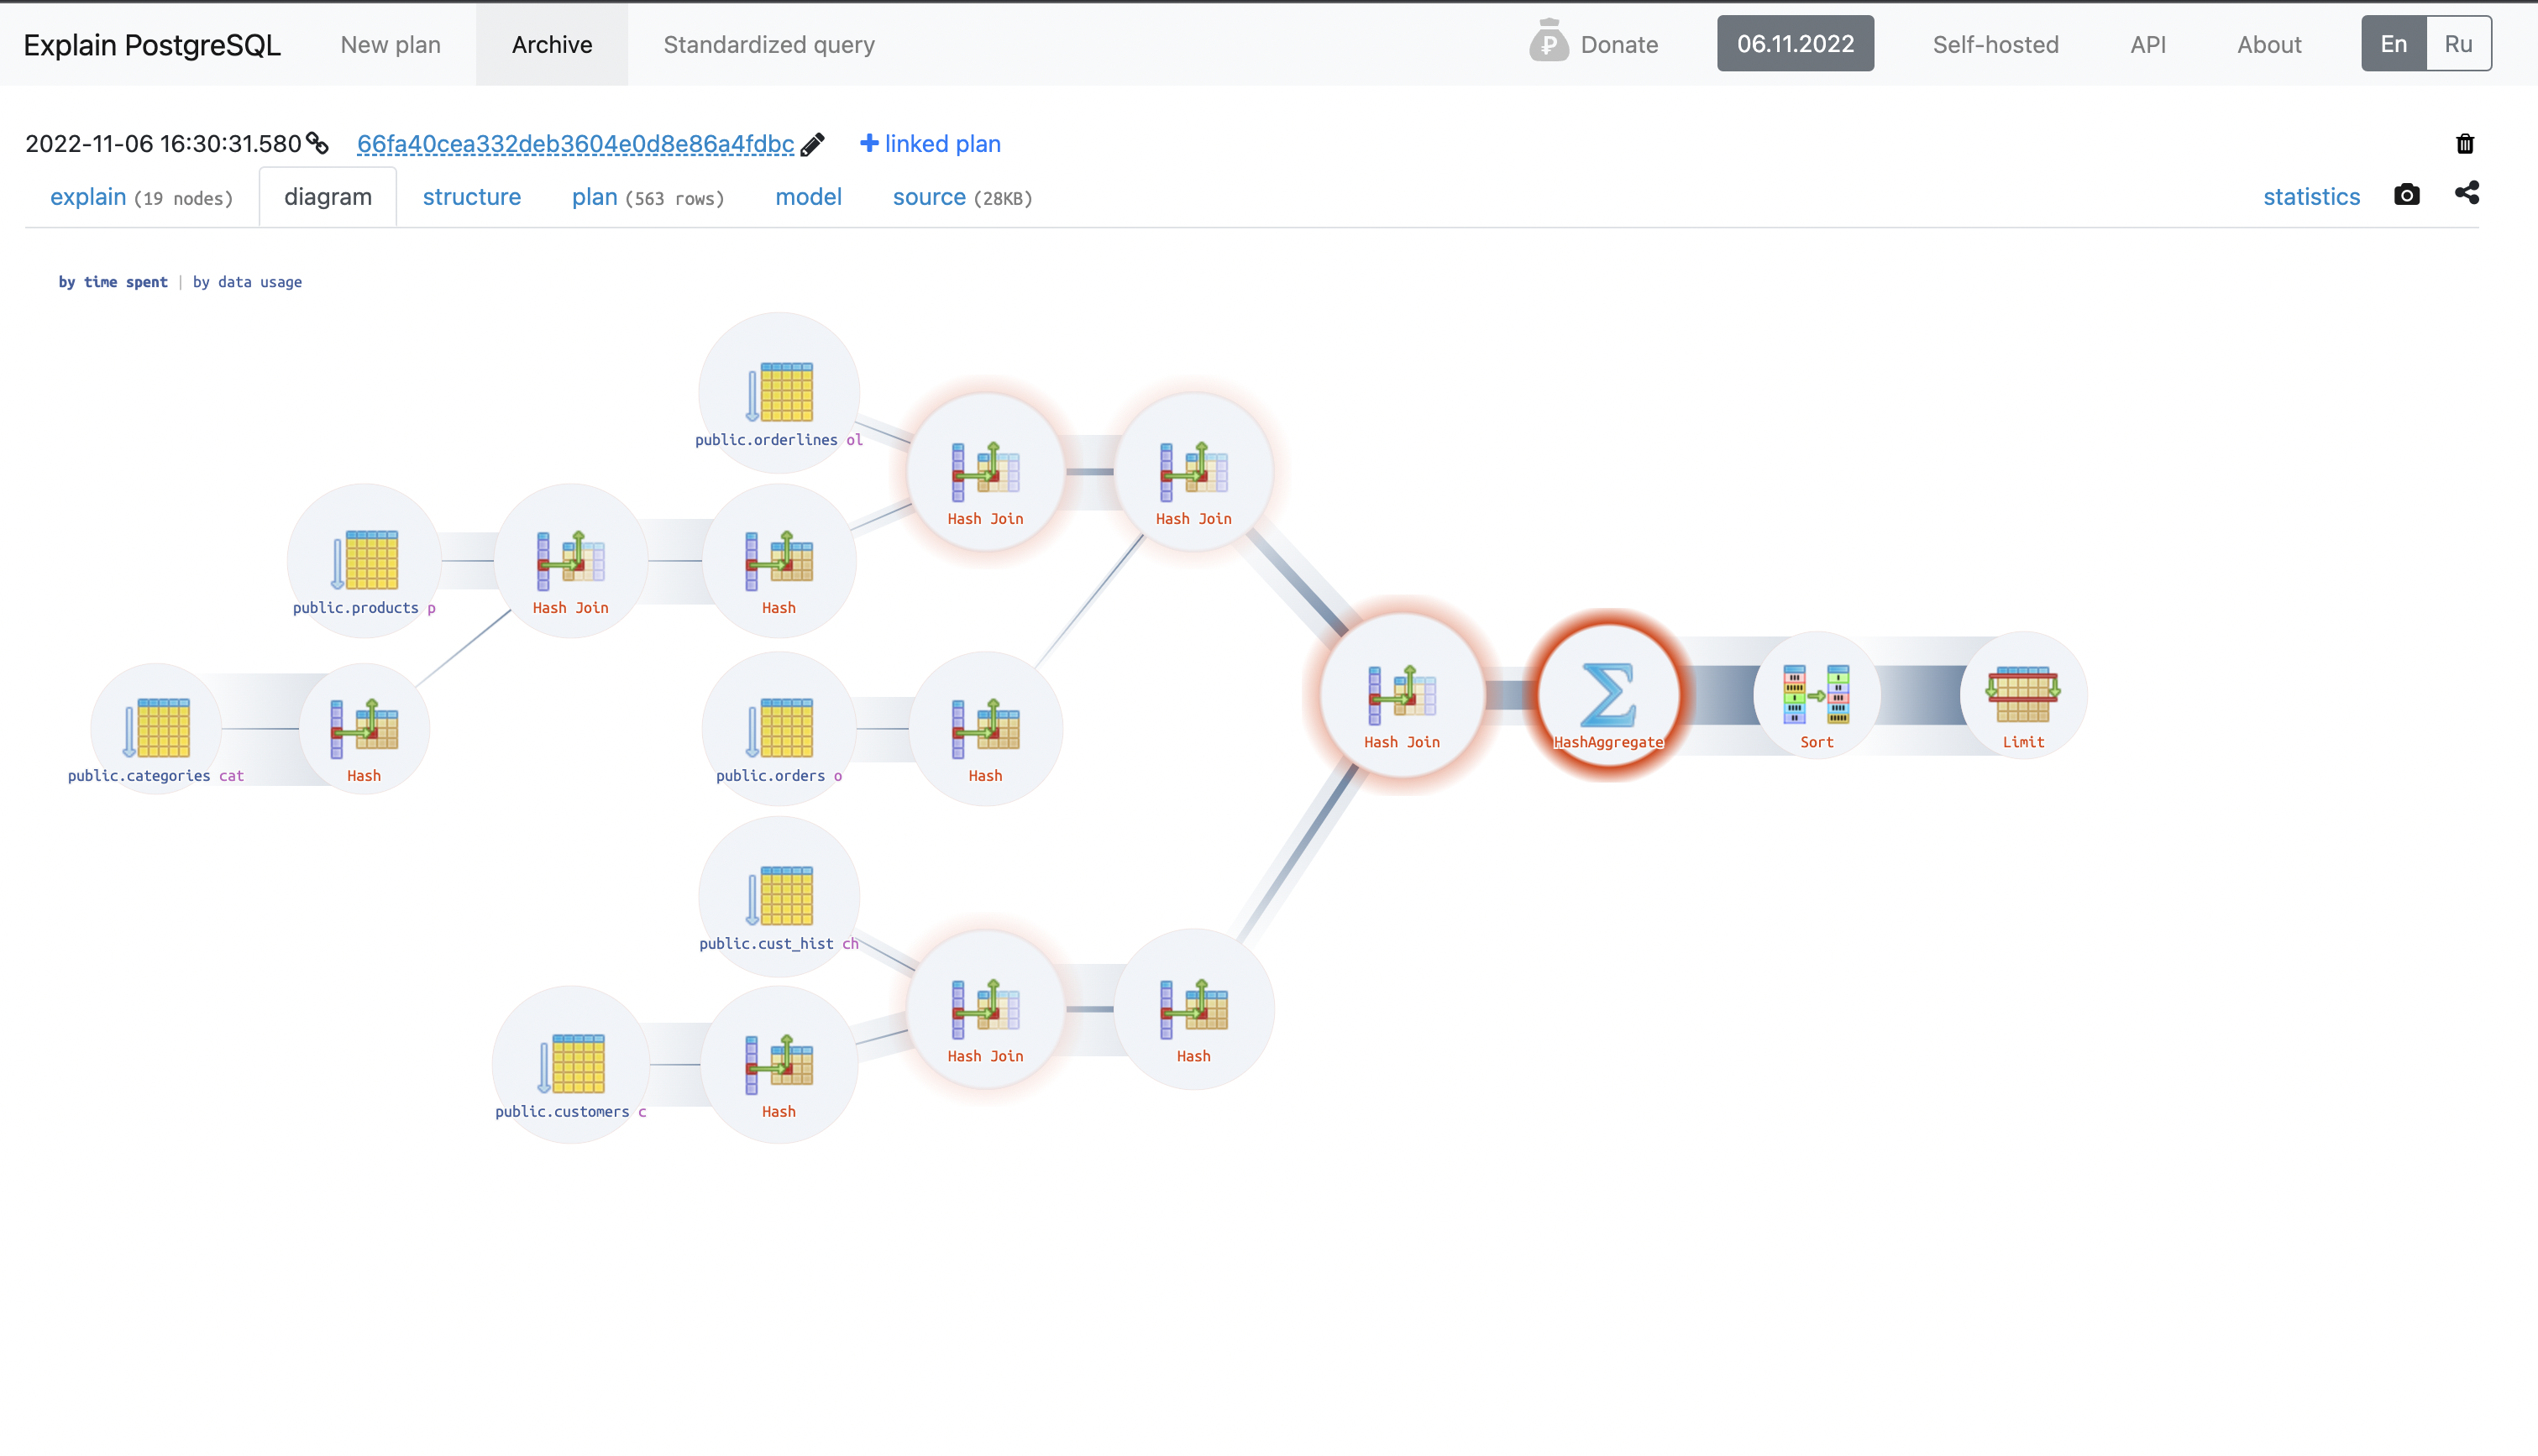
Explain.tensor
- Desc: This tool shows the JSON as a table and highlights the expensive steps. It also shows the diagram and how the tables are joined.
- URL: https://explain.depesz.com/
- Free Tier: Yes
- Open Source: No
- Recommendations on how to solve the problems: No
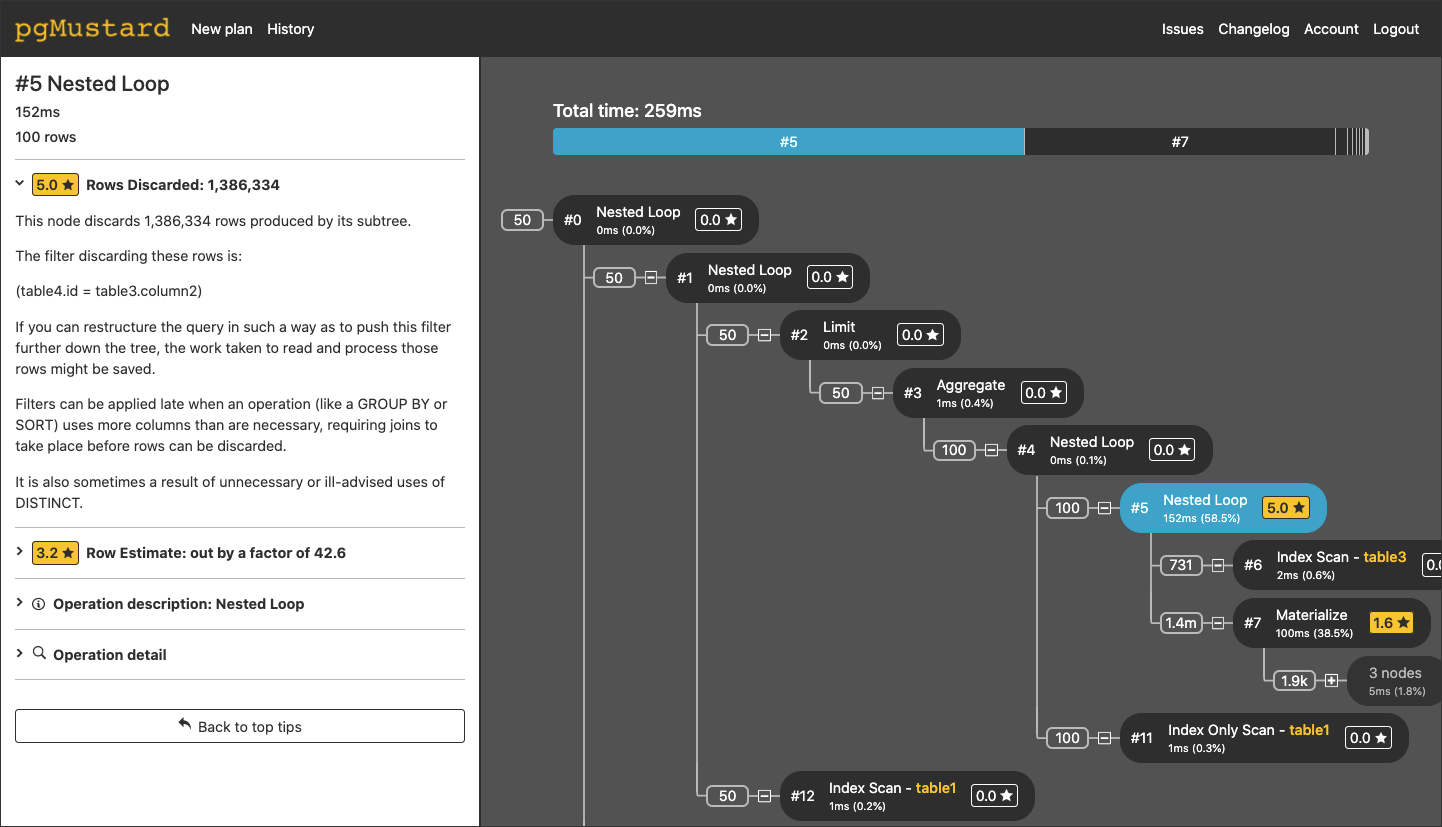
pgMustard
- Desc: pgMustard is another tool that can help you review Postgres query plans quickly
- URL: https://www.pgmustard.com/
- Free Tier: Yes, but for only 5 times!
- Open Source: No.
- Recommendations on how to solve the problems: No
The image is taken from their webpage
Metis
- Desc: Metis helps prevent your database code from breaking production. The app is designed for the analysis of execution plans at scale. Metis was built for modern observability technologies, it integrates with Open Telemetry so the developers can continuously send the execution plans for analysis. Metis not only shows the raw plan (it uses Dalibo under the hood) but also provides insights and remediation plans, based on a long list of best practices. It also has a CLI for a quick analysis of the SQL commands and it integrates with the web app for easier and deeper analysis.
- URL: https://metisdata.io
- Free Tier: Yes
- Open Source: No
- Recommendations on how to solve the problems: Yes!! Metis uses the schema too, to provide deep insights about the problems and how to solve them.
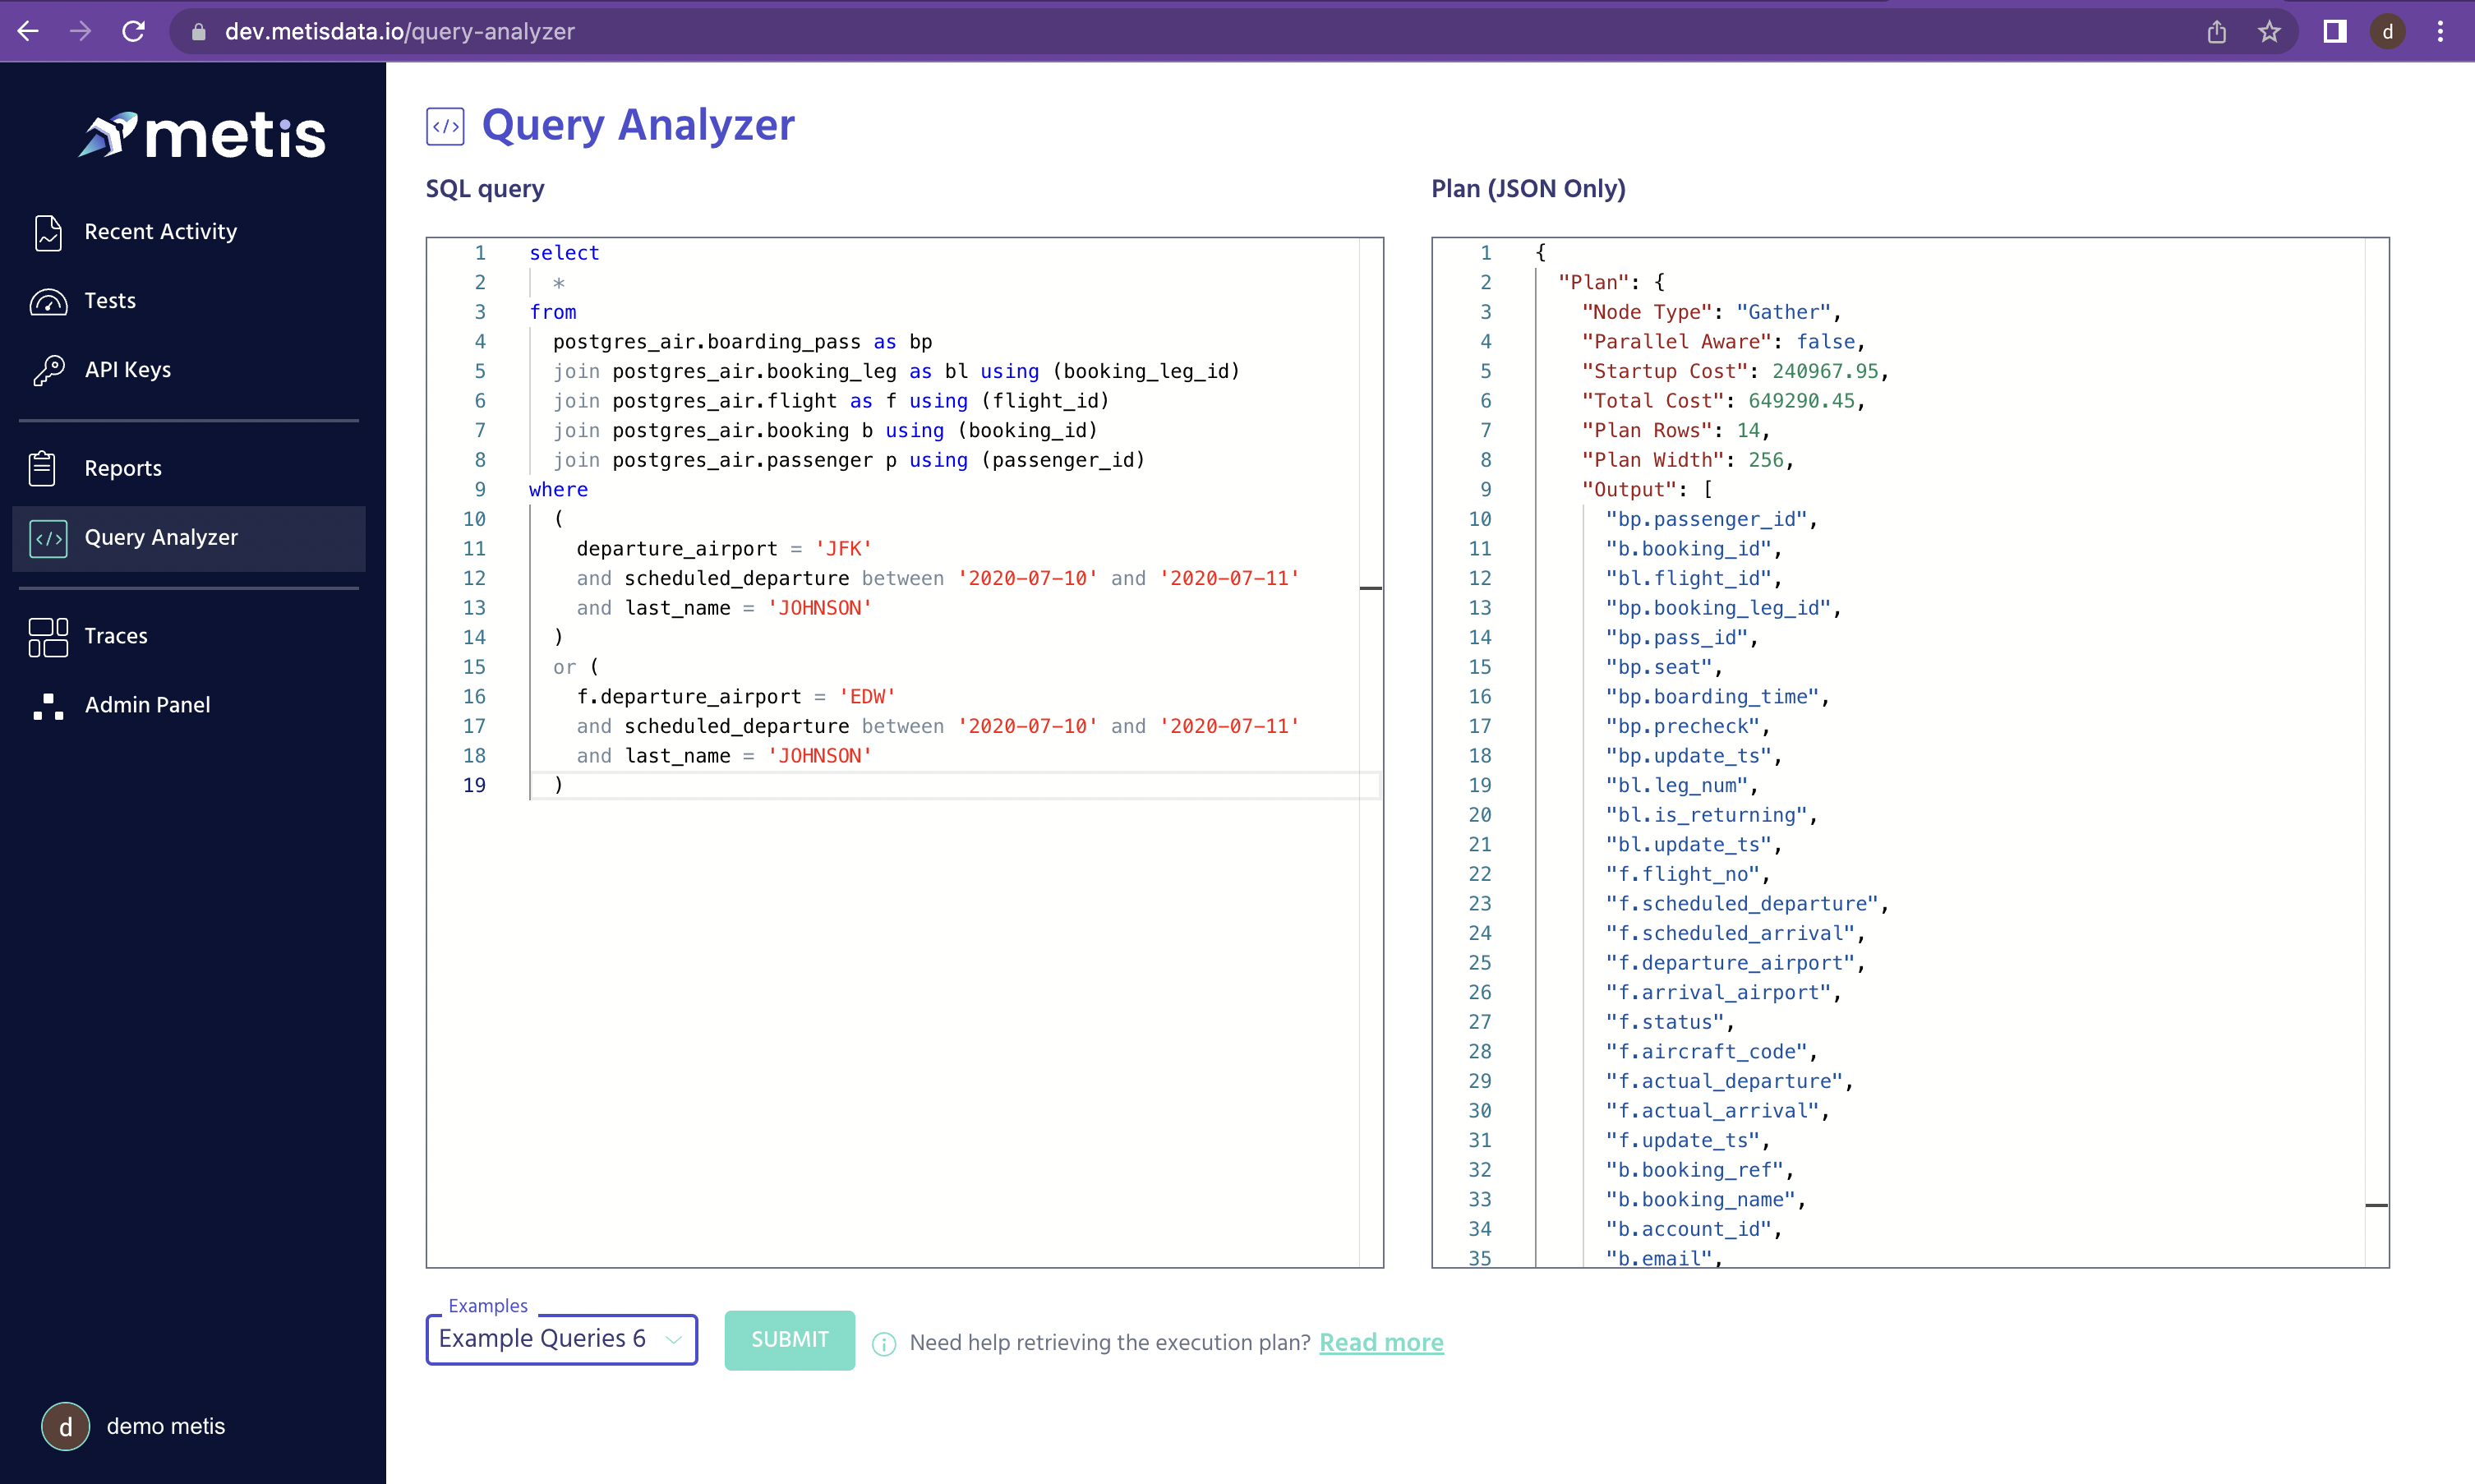
Manually insert a query and the execution plan
 Analyze queries at scale. View the recent activity in one place. Notice the system analyzes each query and shows the detected problems.
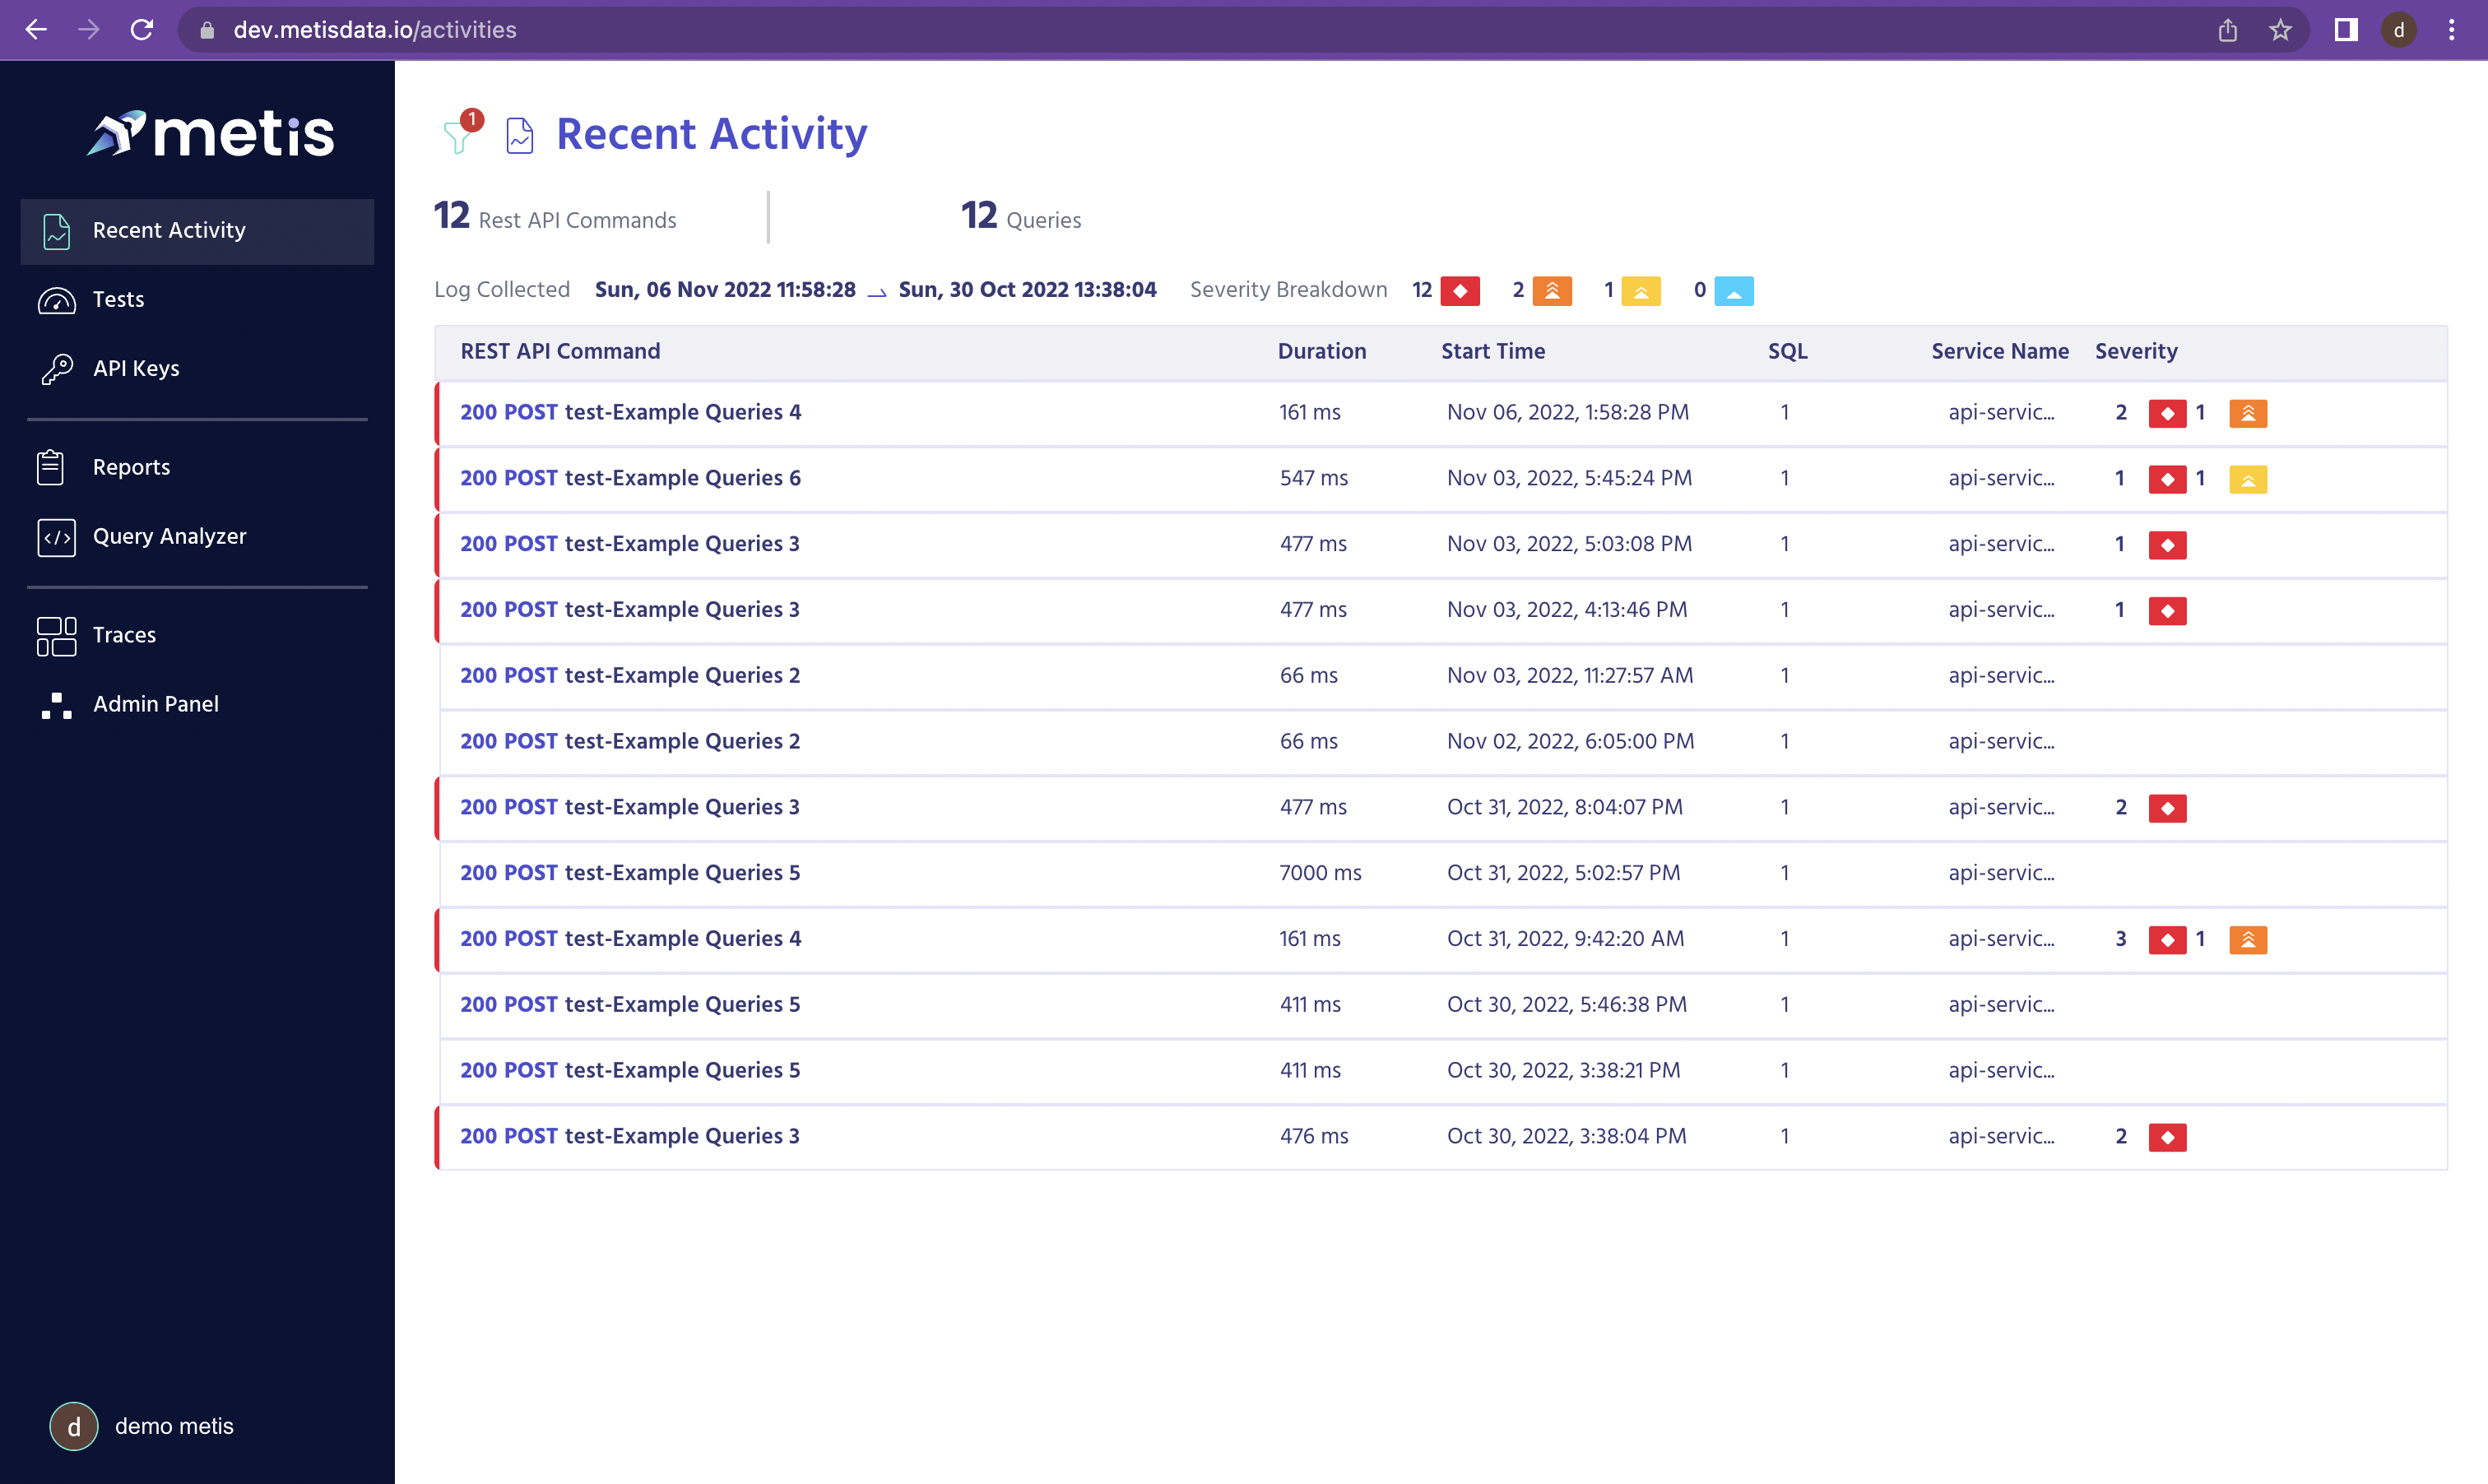 Query Analysis: Open Telemetry Traces integration gives you context, which REST API or GQL command generated the SQLs. Under it - the insights. The insights provide clear explanations about the execution of the plan and what problems were found.
You can read more about Open Telemetry instrumentation here: https://docs.metisdata.io/metis/getting-started/setup/sdk
Query Analysis: Open Telemetry Traces integration gives you context, which REST API or GQL command generated the SQLs. Under it - the insights. The insights provide clear explanations about the execution of the plan and what problems were found.
You can read more about Open Telemetry instrumentation here: https://docs.metisdata.io/metis/getting-started/setup/sdk
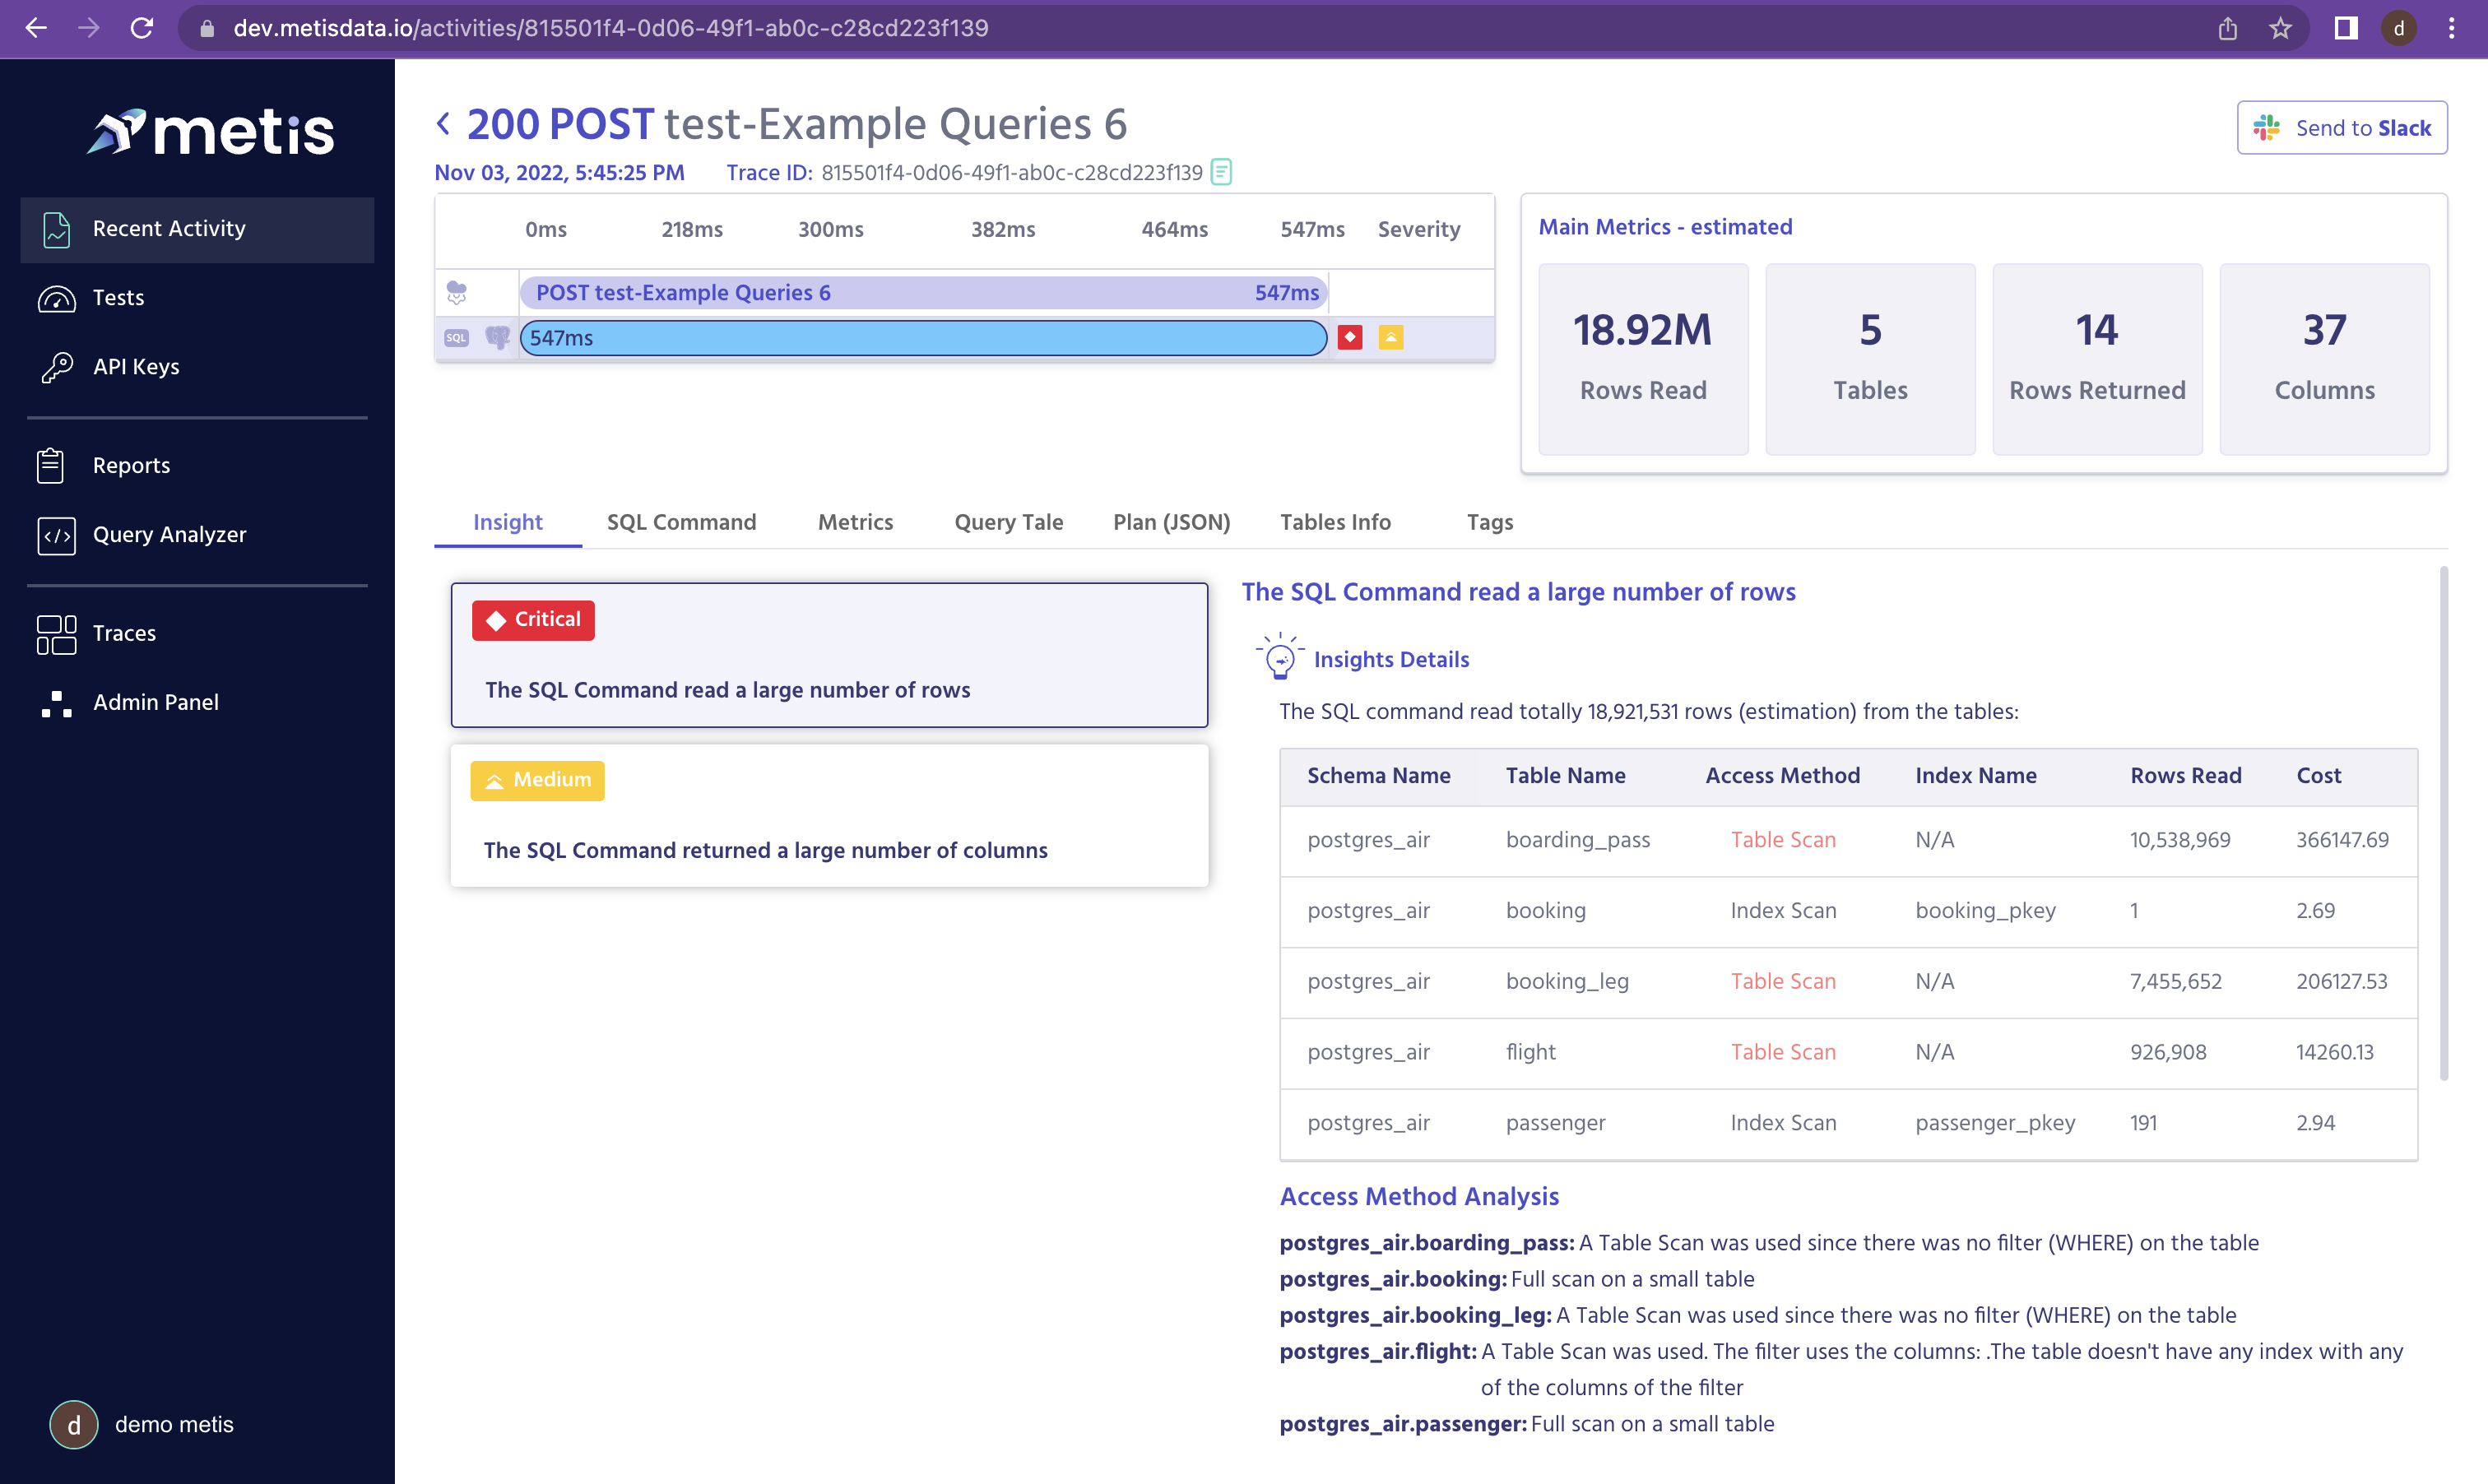 A very powerful feature is the schema enrichment. The execution plan only shows how the DB engine decided to execute the query. But it doesn’t show what other indexes exist, their structure and why the optimizer eventually decided not to use them. That saves a lot of time in analyzing why a query performs badly. Especially for those who are not experts in database internals.
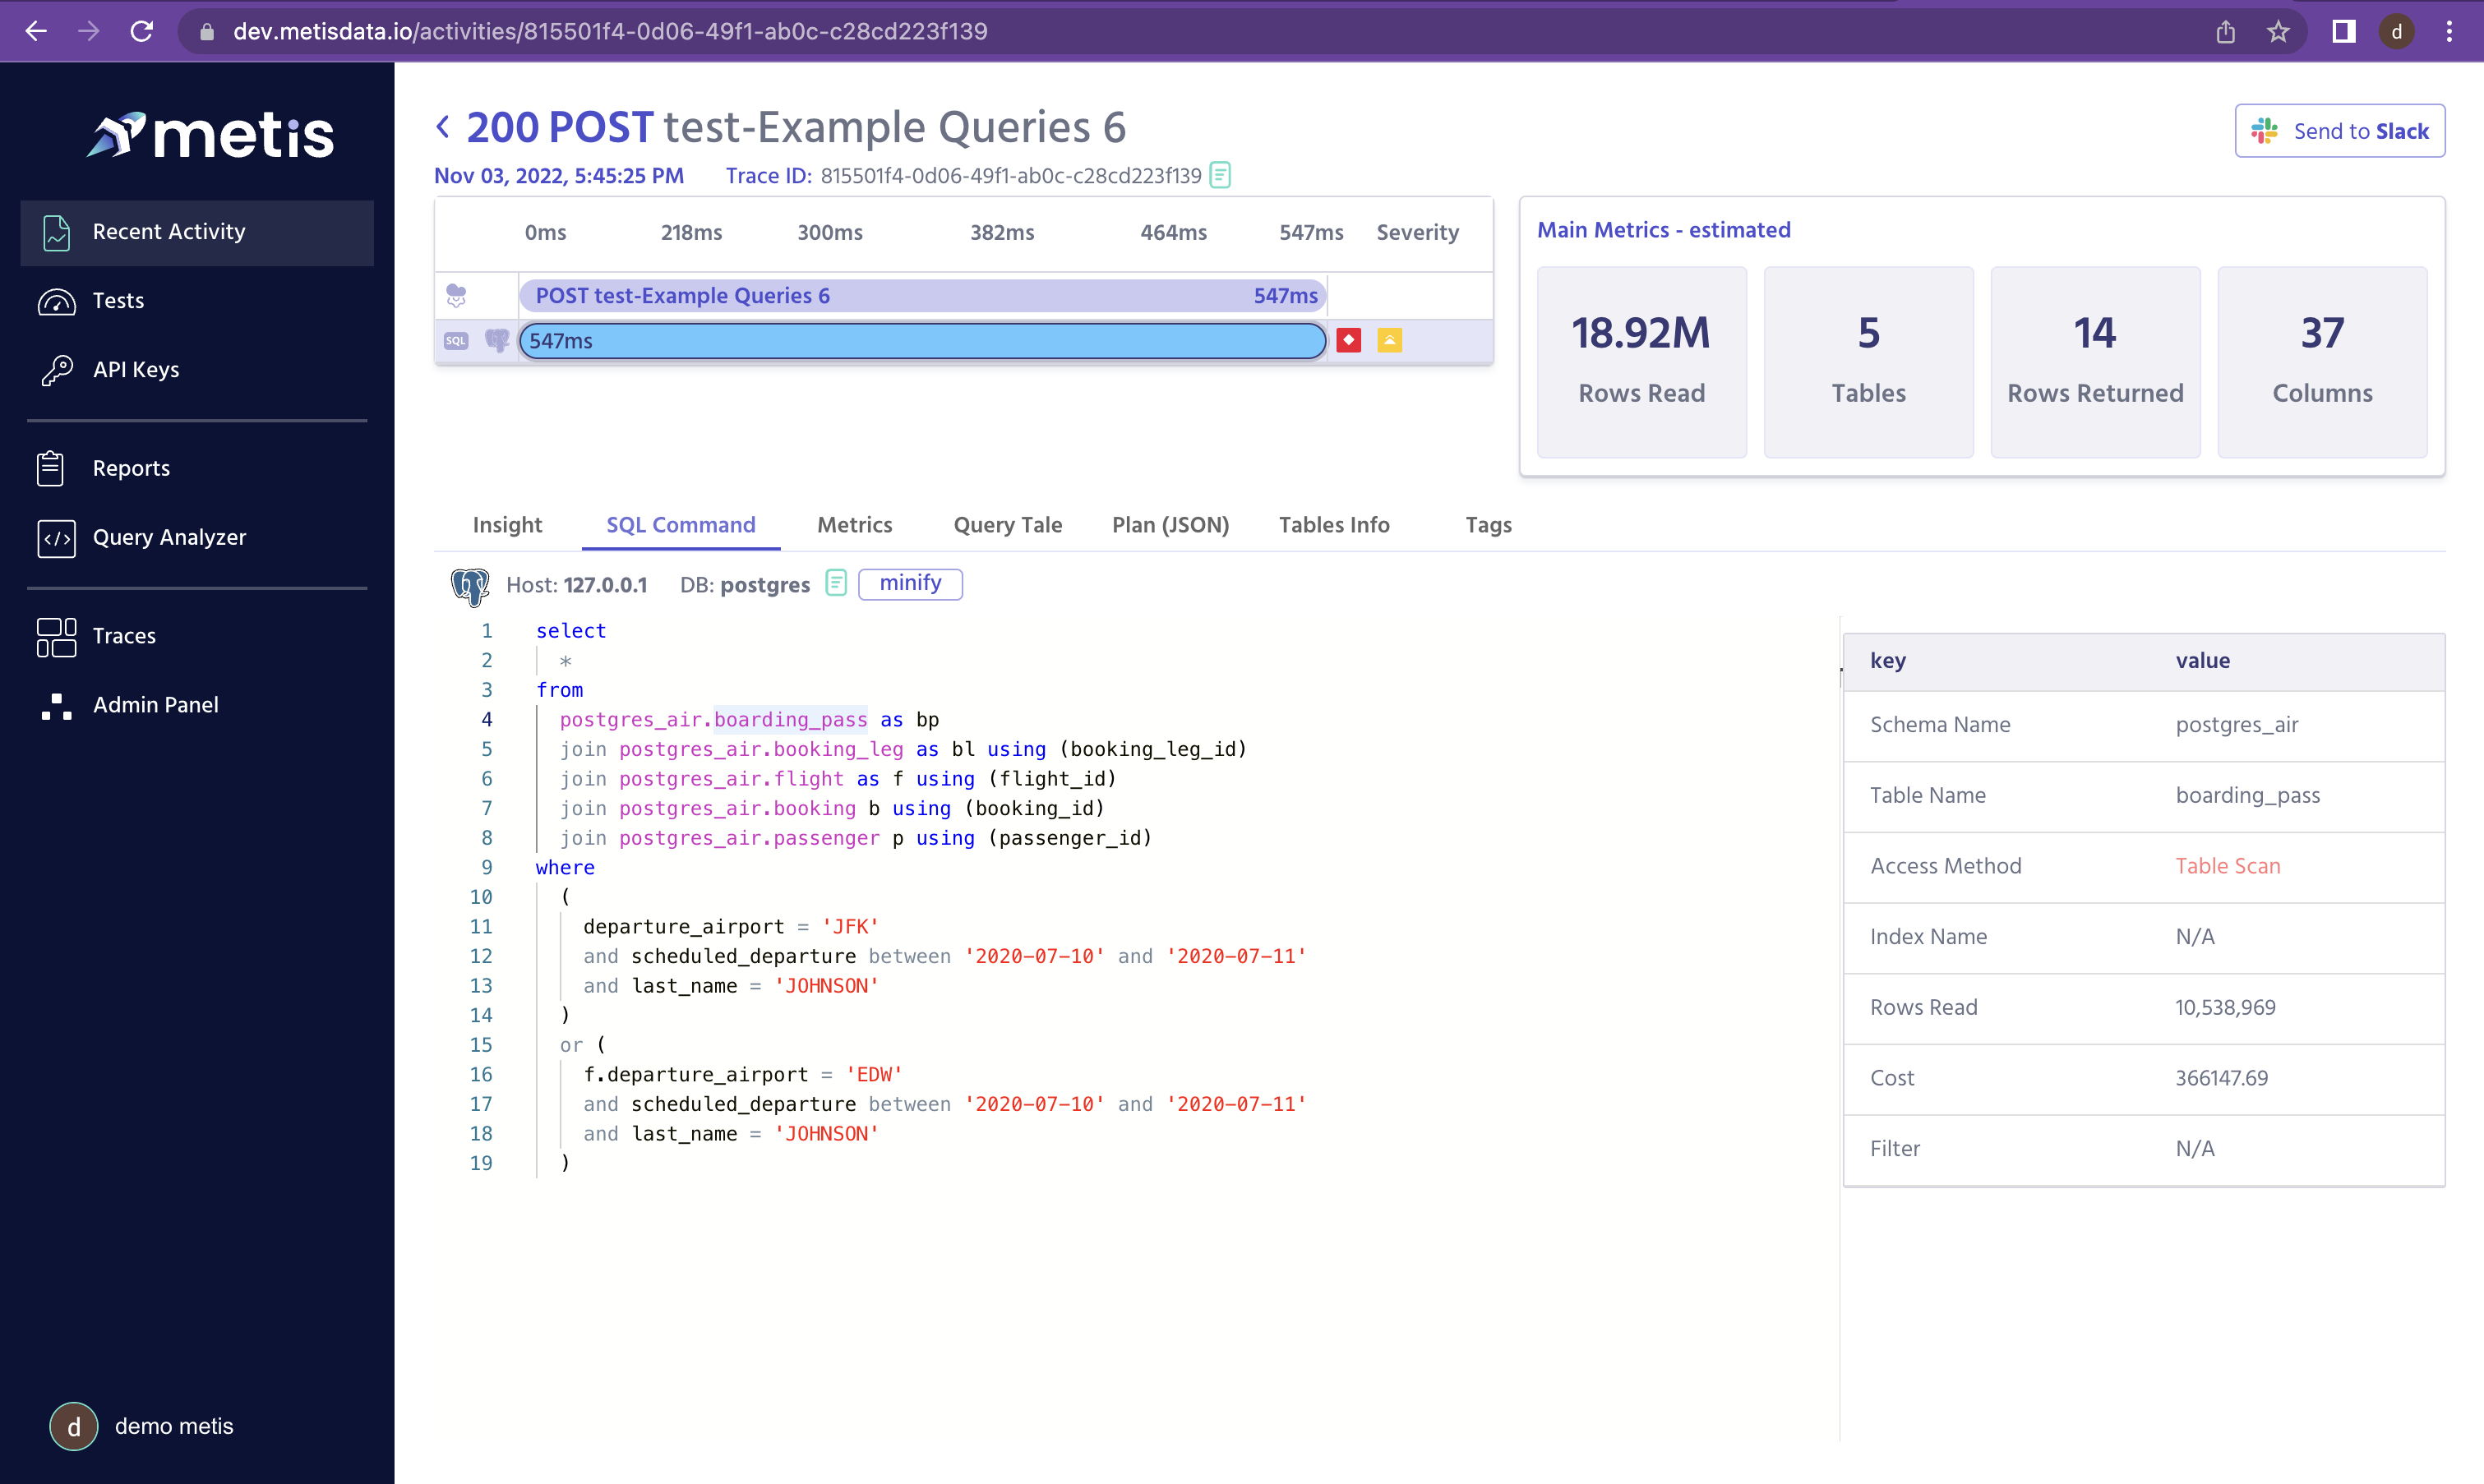
Showing the SQL command and the access method of each table (table scan or index seek) in one screen. That also saves a lot of time in analyzing the query, in a tight correlation of the logical commands and their physical implementation.
Conclusion
Analyzing an execution plan is critical for understanding why a query runs slowly, consumes too many resources or prevents other queries from running (locks). A responsible developer checks the execution plan during development and testing to prevent production problems. Luckily, there are some powerful tools to help you with collecting the plans and analyzing them.
More Resources
- https://scalegrid.io/blog/postgres-explain-cost/
- https://scalegrid.io/blog/introduction-to-auto-explain-postgres/
- About Open Telemetry: https://opentelemetry.io/


