Real-world DB-related problem: Prisma.io limits the number of connections
In this brief case study, we'll explore how one of our clients swiftly tackled a real-world database-related issue and found a resolution.
TLDR:
A new web app, still in development, run slowly. It seems it takes the DB a long time to return the data.
Checking the CPU, Memory and IO for bottlenecks showed no problem. The PG server (AWS RDS) used 7% CPU and had plenty of free memory.
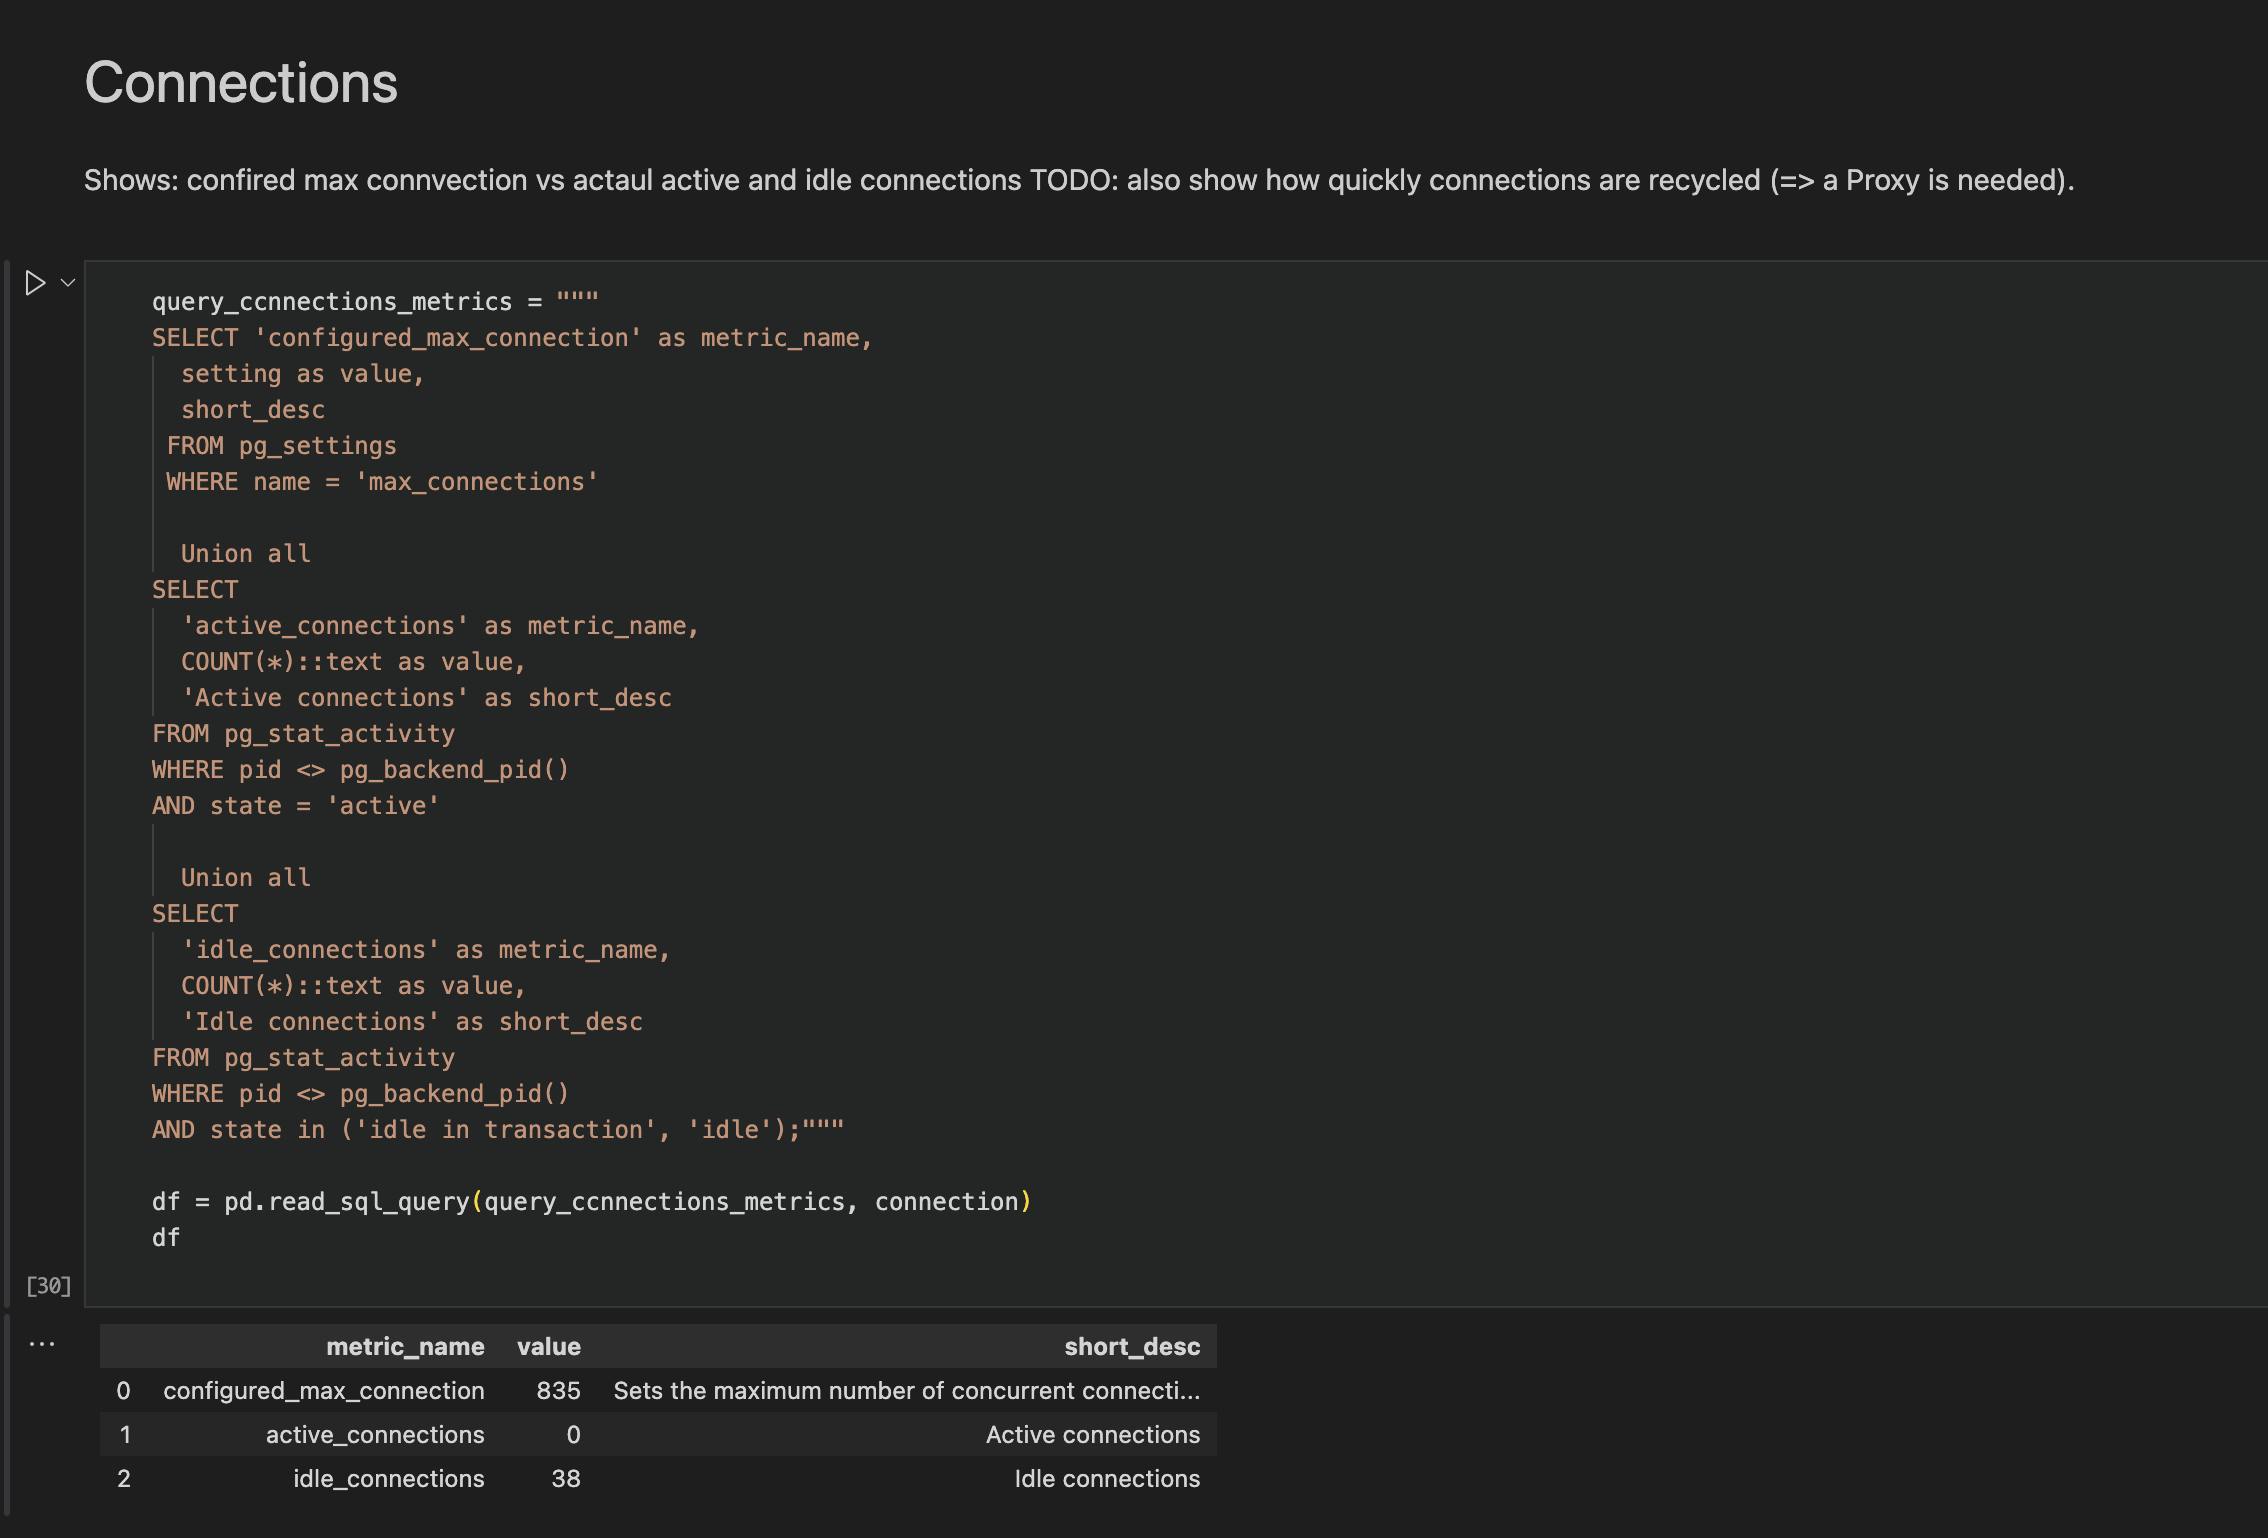
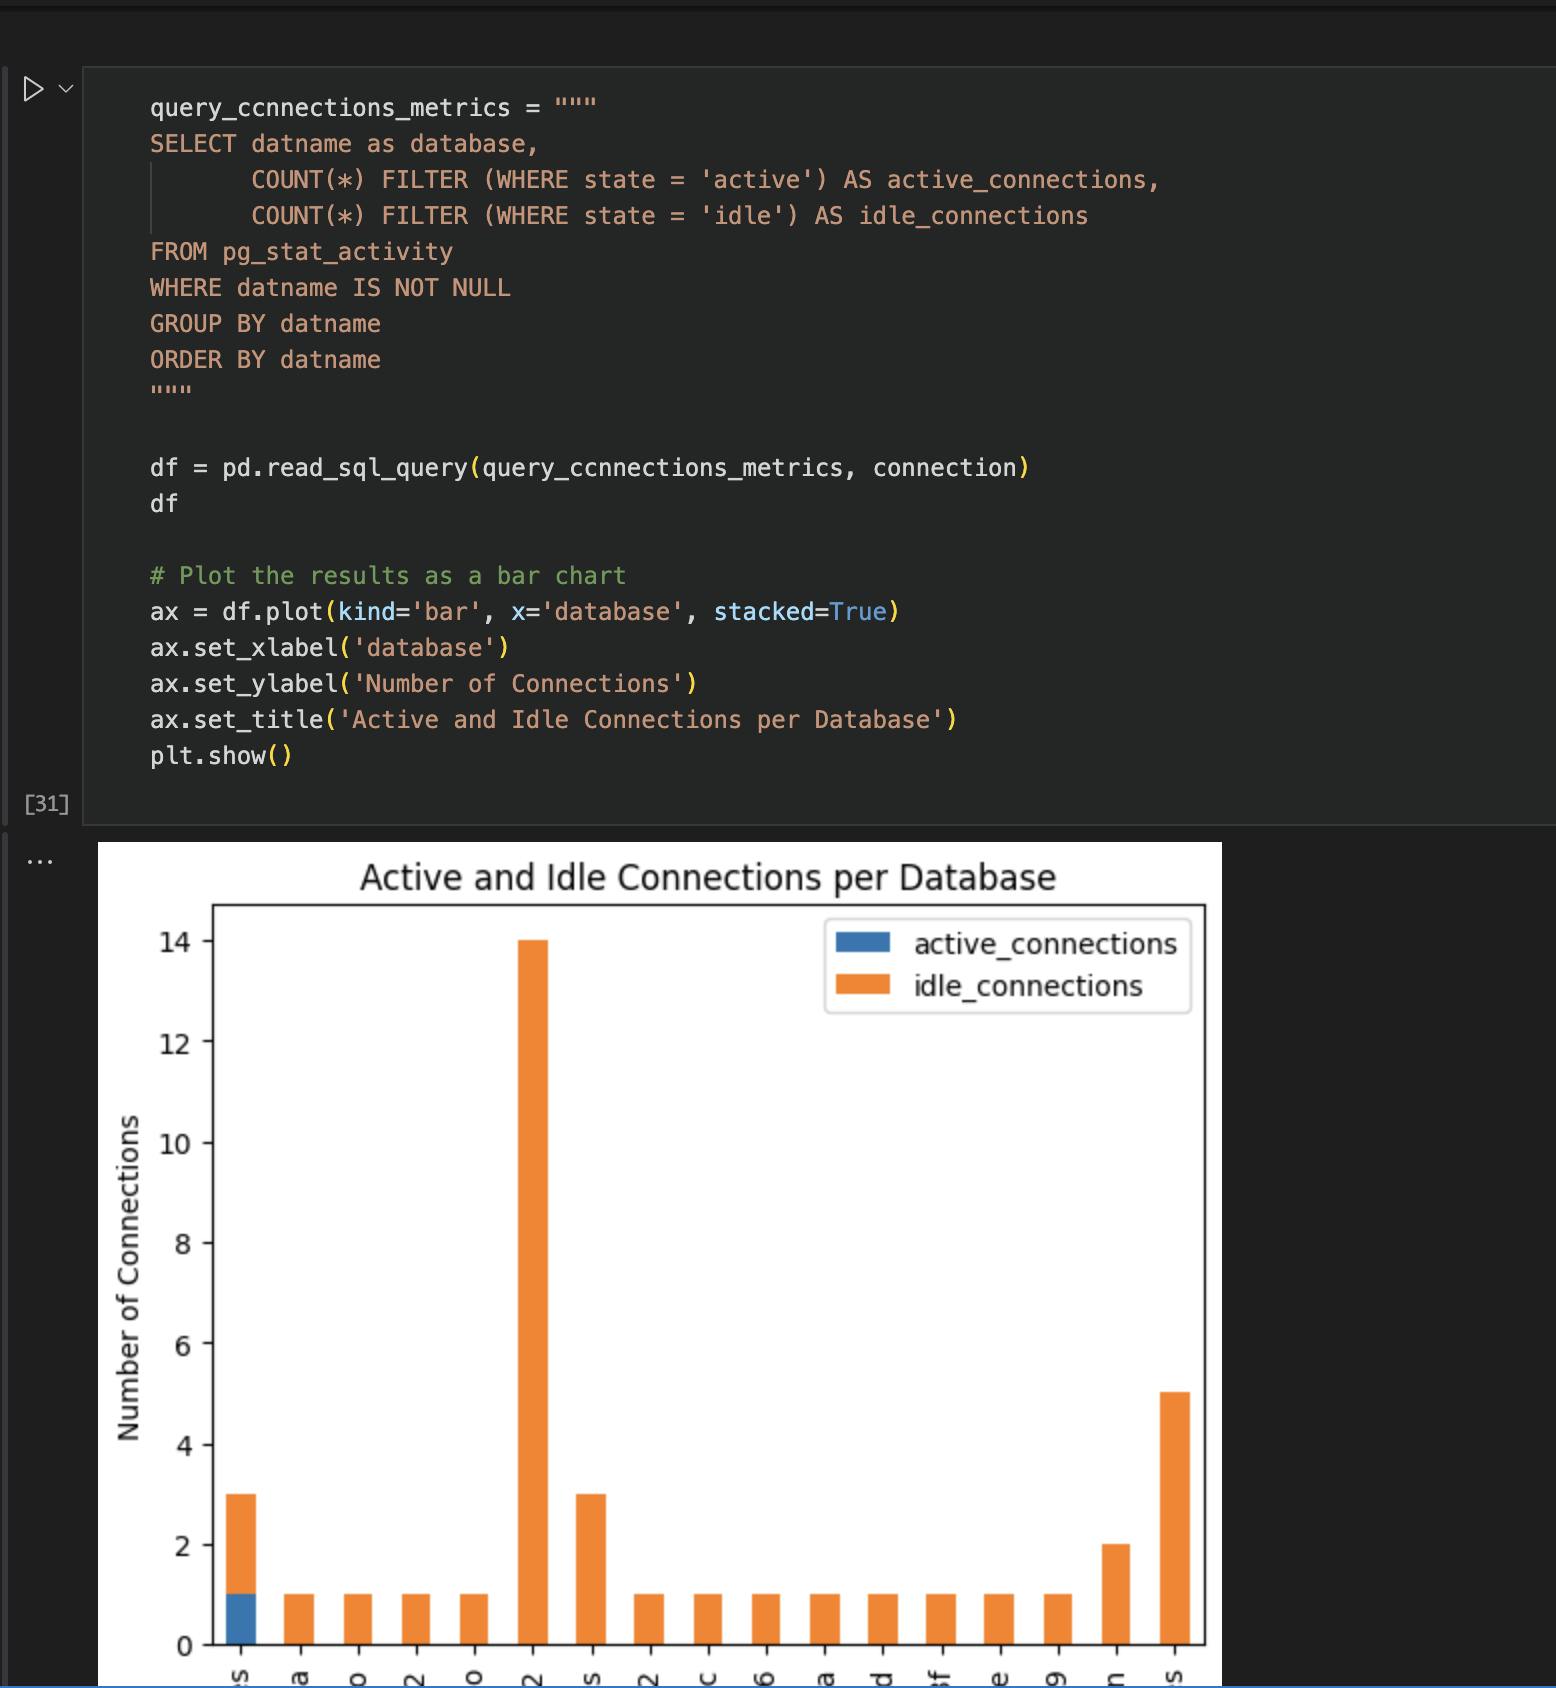
We discovered a low number of active connections on that DB (< 5).
The configuration allowed more than 800 connections (for the entire server). The DB used no more than 5. All other DBs used totally no more than 30 connections.
Since the DB looked fine we investigated the backend. Apparently, the ORM, prisma.io, was configured to allow only 5 connections.
Once we change that to a much higher number, the app run quickly. Especially pages that sent multiple queries.
Instrumentation of Open Telemetry could help a lot by sending traces to the observability system. It would show how the SQL commands wait in a linear flow.
DB Observability Notebooks
Jupyter notebooks can be a powerful tool for quickly detecting database-related problems and gaining valuable insights into their root causes. By connecting to a database and leveraging data analysis libraries like pandas and matplotlib, data analysts can quickly explore and visualize the data, identify anomalies, and troubleshoot issues.
The DB Observability Notebook project is an open-source initiative that offers Jupyter Notebooks as a useful resource for resolving database-related problems. These Notebooks provide SQL commands and insights, which are later integrated into the Metis DB guardrail platform to create an automated investigation flow.
More Details
- Prisma.io connection pool configuration:
- Using DBON to compare the configured max connections vs. the actual ones.

Connections per DB
